
Hitting With Runner on 2nd & No Outs
Published:
This week, while watching the Chicago Cubs take on the Pittsburgh Pirates, a particular situation caught my attention: a runner positioned on 2nd base with zero outs. Despite the Cubs struggles throughout the regular 9 innings, their performance notably improved during their long opportunity in extra innings as they demonstrated a newfound ability to score with ease in this situation. This observation prompted me to think about several inquiries regarding teams and hitters’ strategy in these pivotal moments.
- In extra innings, teams are more focused on scoring the runner on second rather than extending an inning. Does this change how teams approach the situation such as electing to sacrifice the runner over more often?
- When not sacrificing, do hitters try to hit the ball to the outfield or on the ground more often?
- How often are hitters successful in this situation?
Image comes from Yahoo Sports News.
Utilizing play-by-play data from Baseball Savant covering the years 2020-2023, I conducted an analysis to gain insights into hitters and teams’ performance/strategy in this situation. The study focuses specifically on situations where a runner occupies 2nd base and there are zero outs in the inning, resembling the beginning of an extra inning. By examining this scenario, the goal is to discern how teams and hitters adapt their strategies when faced with the unique dynamics of extra innings compared to regular gameplay.
Regular Innings
During the regular 9 innings of a baseball game, teams aim to extend each inning and maximize their scoring opportunities. Sacrificing a runner to third base via a bunt may appear as counterintuitive, as it involves recording an out. Consequently, many teams decide not to use this strategy. Instead, hitters are tasked with delivering a successful at-bat, either by driving in the runner or advancing them to third base while attempting to reach base themselves.
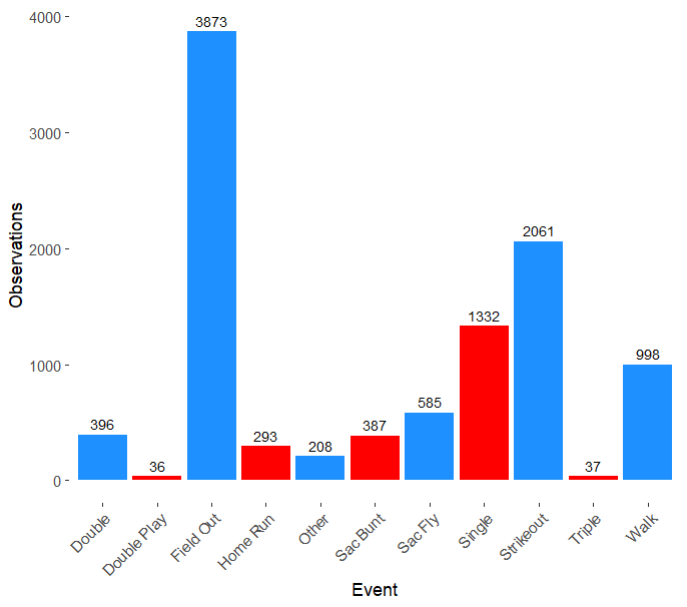

We can see that teams favor allowing their hitter to swing away in this scenario, with sacrifice bunts accounting for about 4% of the total instances. However, hitters successfully extend the inning approximately 30% of the time by recording a single, double, triple, home run or walk. In other words, a hitter will score the runner from 2nd around 20% of the time which is a very good rate. So, during regular innings, hitting a sacrifice fly or bunt may not be worth it. However, let’s dive deeper to see why this may be the case using delta home win expectancy!
The delta home win expectancy provides insight into the change in likelihood of the home team winning, factoring in various game situations such as score, inning, outs, and runners on base. In the context of this analysis, a positive delta home win expectancy in the bottom half of an inning signifies a favorable or “good” at-bat outcome. Conversely, for the away team, a negative home delta win expectancy in the top half of an inning indicates a positive or “good” at-bat result.
The table illustrates that an increase in win expectancy resulting from a single at-bat is considered a “good” outcome. Generally, reaching base safely base is the best for delta home win expectancy. However, it’s important to note that sac bunt and sac fly are also considered a good at-bat during regular innings in this situation, despite recording an out.
Extra Innings
The implementation of the rule allowing a runner to start on second base was initiated during the shortened 2020 season and later fully adopted. Scoring the runner at second base becomes extremely crucial, because once on defense it is very challenging to prevent the run from scoring. In the context of extra innings, a strikeout in the leadoff spot represents the worst-case scenario, as it fails to put the ball in play, resulting in a 0% change for the runner to either score or advance a base. Given that runs hold a heightened significance in extra innings due to the tied nature of the game, even securing a one-run lead can often suffice for victory. Initiating the inning with a “good” at-bat significantly increases likelihood of a better delta win expectancy.
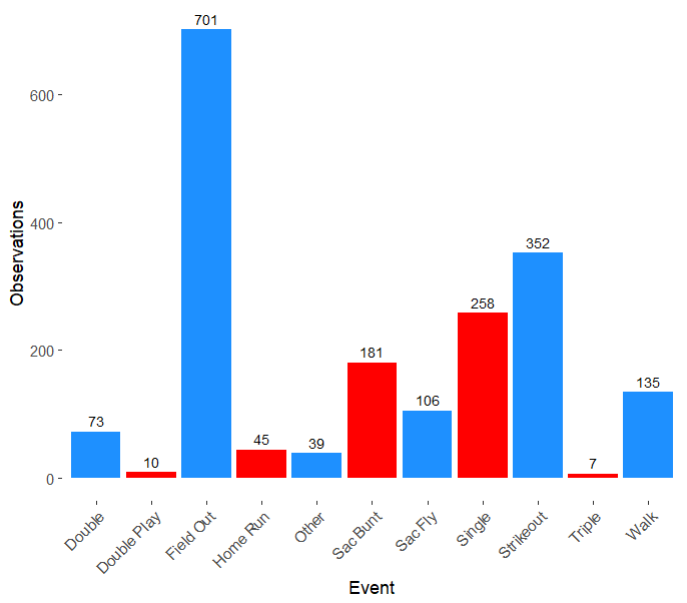

In extra innings, a hitter safely reaches base by single, double, triple, home run, or walk approximately 28% of the time. By recording a base hit, the runner will likely score which accounts for 21% of the data. However, what is notable is the occurrence of sac bunts, being 9.5% of the time. Teams frequently elect to sacrifice the runner to third in attempt to score the go ahead run in extra innings. This rate is 5% higher than in regular innings which means that teams value a runner at third with one out, over a runner at 2nd with 0 outs. Furthermore, the strikeout rate experiences a 1.5% drop, signaling a strategic shift where teams are telling their hitters the ball must be in play. This is attributed to the high-stakes nature of extra innings, where a strikeout in this situation could lose the game, prompting hitters to adopt a more contact-oriented approach.
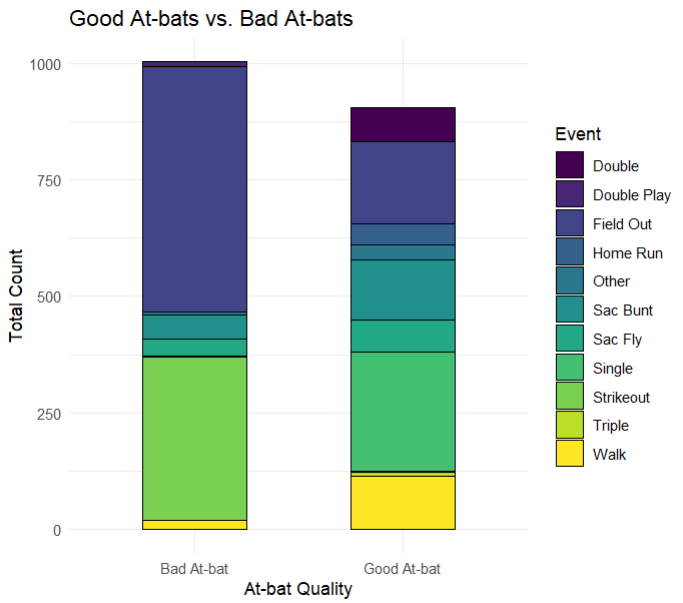
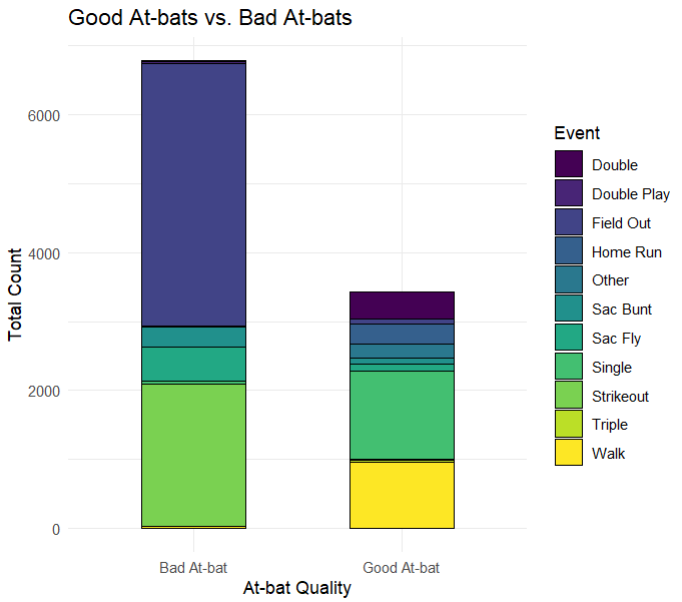
This stands out as one of the most intriguing finds from the study! The proportion of “good” at-bats during extra innings in the situation is notably higher, at 47.5%. This disparity could be attributed to the heightened significance of each at-bat in terms of delta win expectancy during extra innings. In late-game situations, the impact of scoring a run to take the lead is magnified compared to scoring a run in an early inning. However, it is important to note that the chart wasn’t weighted to account for this significance; rather it was designed to simply tally the number of “good” or “bad” at-bats.
Comparing Both Situations

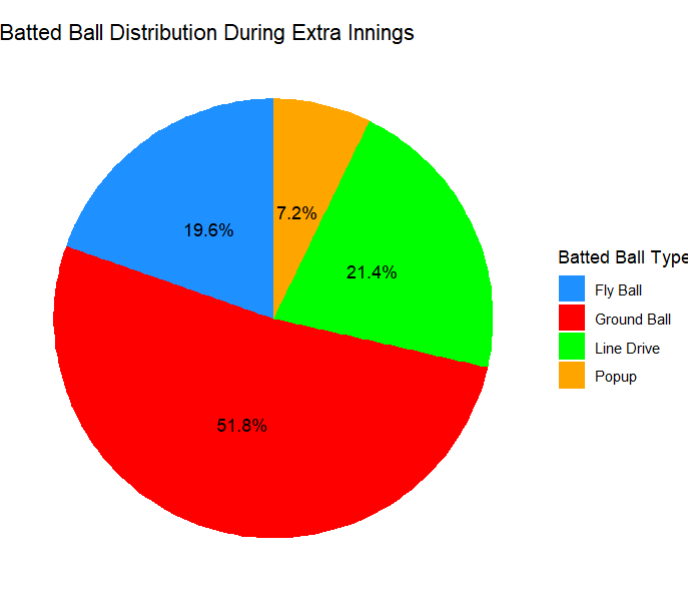
The pie charts provide visual representation of the distribution of batted balls during both regular and extra innings within the highlighted scenario. These charts offer insights into the hitting strategies that are employed by teams depending on the inning of the game. Notably, in extra innings, hitters demonstrate tendencies to keep the ball on the ground more often than regular innings. This approach likely can be attributed to advancing the go-ahead runner to either third or home, maximizing the chance of scoring.
On another note, the analysis of delta home win expectancy reveals a significant difference in the frequency of “good” at-bats between regular and extra innings. While only 33.6% of at-bats result in a “good” outcome during regular innings, the number increases to 47.4% during extra innings. This can once again be credited to the heightened importance of scoring runs in the late stages of a game. Consequently, sacrificing a runner to third base holds a greater value in terms of delta win expectancy during extra innings.
Conclusion
Certainly, the data underscores the strategic advantage of sacrificing the runner to third in late-game situations, especially extra innings. A runner at third with one out holds more value than a runner at second with no outs in a late game situation. Therefore, teams would benefit from considering the option of sacrificing the runner to third more frequently, as it heightens the likelihood of scoring a run. Of course, it depends who the runner and hitter is, however it is quite interesting to think about!
Other ideas:
- Take a look at how players may approach this scenario depending on the score.
- Take a look at how each team goes about this situation with a runner on 2nd and no outs.
- Take a look at which batter counts generate higher delta win expectancy changes in this scenario.
- Take a look at other situations rather than just runner on second with no outs where teams produce different strategies.
- What other situations require lots of strategy in terms of running a play or sacrificing?
Citations
- Passan, J. (2024, May 13). Takeaways from New Statcast MLB Bat-Tracking Data. ESPN. https://www.espn.com/mlb/story/_/id/40120458/mlb-statcast-bat-tracking-data- giancarlo-stanton-luis-arraez
- Puskar, G. J. (2024). Cubs Celebrate. Yahoo Sports. photograph. Retrieved from https://sports.yahoo.com/patrick-wisdom-homers-10th-lifting-211542534.html? guce_referrer=aHR0cHM6Ly93d3cuZ29vZ2xlLmNvbS8&guce_referrer_sig=AQAAAHeUMtaWxwcCqP93sWd08-uuZqRDKoQRtR0LpCMnI-X_L0WO9Za4P1yGXUYBGQCyJtMXvq43oVARjsRXqchy0YfORVQp6uQJ1zBGLNQB_tzx0G957barEHNaysY8cTPM0FHkvVs6s97lUW-ee2SgvlBhCLax7pXX_YSIB-VnsFpX.