
Evaluating the Relationship Between Pitch Location and Batted Ball Directional Success at the MLB Level
Published:
 </div>
Abstract
For years, hitters have been taught to “hit the ball where it’s pitched,” but recent trends in the MLB have revealed the advantages of pulling the ball. This study dives into the relationship between pitch location, pitch type and batted ball direction to better understand how hitters achieve the most successful outcomes. Using modeling, machine learning, and visualizations, the results show that pulling the ball on pitches throughout the strike zone, even outside corner, tends to lead to better offensive production. These findings challenge the traditional narrative and suggest that teams should teach hitters to hit the ball out in front of their body to pull the ball for more power.
1. Introduction
Growing up playing baseball as a right-handed hitter, I was always taught to “hit the ball where it’s pitched”, meaning that I pull inside pitches to left and hit outside pitches to right field. I always felt that when I tried to hit the ball the other way, I was losing power and felt more confident pulling the ball.
In a Fangraphs article by Ben Perry in 2022, he questioned the phrase “hit it where it’s pitched” which inspired this study to be conducted on a deeper level. In another recent study conducted by Mike Petriello, he concluded that hitting the ball 36 inches out in front of the body’s center of mass leads to the most success in terms of power.
This shift in hitting has led teams to rethink conventional ideas about swing approach. There is now greater emphasis on promoting aggressive swings designed to pull the ball except in specific situations or pitch locations that demand a more defensive approach. Hitters are being trained to hunt pitches they can drive out front. These adjustments reflect a deeper understanding of how contact point, swing path, and bat speed all interact to influence batted ball outcomes.
By examining correlations through visualization, generalized additive models and XGBoost machine learning techniques, this research analyzes how different pitch characteristics affect the success of pulled, straightaway, and opposite-field contact. By identifying patterns in batted ball behavior based on pitch location and type, the study seeks to provide insights that could help hitters, refine approaches to maximize offensive performance.
2. Literature Review
In the past, there has been research dedicated to understanding at what point hitters should make contact with the ball in terms of success, but there hasn’t been much research on where a ball should be hit based on where it was pitched in the zone. To understand what this article examines, let’s take a step back to understand what has already been researched.
2.1 Similar Baseball Modeling Techniques
To better understand how hitters hit the ball a certain way, we must first understand how researchers understand the game and have gone about this topic in the past. Analytics in baseball force teams to ask better questions and push old narratives that have been around in baseball for decades. For example, what if we could predict a batted ball’s outcome based on swing mechanics and batted ball metrics.
Albert (2018) did just that by using Generalized Linear Models (GLM) to forecast hit probability based on launch angle, exit velocity and spray angle. His findings revealed that spray angle was a key contributor when predicting ground ball outcomes and a significant predictor of whether or not it resulted in a hit. The direction of balls hit in the air proved to be less critical. Albert’s study used GLM’s and visualization to display how important spray angle is when determining how successful a hitter will be with a certain batted ball.
In other light, defense hasn’t been left behind during the transition of data into the baseball world. Jensen, Shirley, and Wyner (2009) shifted the analytical spotlight to analyzing fielders by using Bayesian Hierarchical models on batted ball data. By borrowing strength across positions and players, they crafted a fair set of rankings and assessment of fielding performance. This study provides a method for evaluating complex aspects of player performance.
Both aproaches form a foundation for understanding baseball in a new light. It’s not about whether something happened, but rather why or how often it should have happened. This thinking opens a door for a deeper dive into how hitters can maximize outcomes by targeting pitch types, locations and directions.
2.2 Culminating the Strike Zone Area
Before diving into batted balls, it is important to understand the strike zone and the idea that it can possibly change based on certain factors of the game including which umpire is behind home plate for each pitch. Before a batter swings, there’s a more fundamental question: Was the pitch even a strike? The strike zone is both a physical space and a psychological battleground, shaped not just by rules but by human judgment.
Each at-bat, hitters must decide which pitches are in the strike zone before they make it to the plate to help determine whether or not they should swing. Green and Daniels (2014) identified notable patterns in umpire calls, revealing that specific regions of the strike zone, particularly the borders, are more susceptible to subjective interpretation. This revealed variability influences hitters’ swing decisions and directional strategies making it challenging to determine when a strike is consistently called each at-bat.
Taking a small step back, Roegele (2013) provided detailed visualizations of how the strike zone has evolved over time, highlighting the ways in which umpire behavior shapes hitters’ approach to the plate. His work demonstrated the living nature of the strike zone, as different zones are emphasized or neglected over time. These trends affect when and where hitters decide to swing, especially when accounting for pitch framing and umpire tendencies.
Zimmerman, Tang, and Huang (2019) expanded on this concept by outlining variations in the called strike zone based on pitch location and context, such as pitch count. Their analysis revealed systematic patterns in called strikes and demonstrated that hitters must consider these tendencies when determining swing direction. A tighter or more expansive zone in a particular area can heavily influence whether a hitter pulls the ball or goes opposite field.
Finally, Glaser (2010) added to this discussion by analyzing how a batter’s expectations influence their perception of pitch location. Hitters anticipating pitches in certain areas are more likely to swing and to direct the ball,toward specific zones. This psychological component plays a role in directional hitting strategy as well.
Together, these studies emphasize that the strike zone is not a fixed concept but a fluid and interpretable one. For hitters aiming to make optimal directional decisions, understanding the evolving shape and consistency of the strike zone is essential
2.3 Hitting Certain Pitch Types
When optimizing a hitter’s approach at the plate, swing decisions are crucial. Hitters must not only judge whether a pitch is in the strike zone, but also asses what type of pitch they are bing thrown to time their swing and put the bat in the correct spot if the ball has movement. Understanding how hitters respond to different pitch types provides further clarity on their directional tendencies. Perry (2022) found that hitters often align their swing paths with the location and movement of the pitch, suggesting that hitting direction is frequently a response to pitch type. When pitches arrive in zones conducive to pulling or going the other way, hitters tend to adapt their approach accordingly.
Once the ball is hit a certain direction due to the pitch type, it is important to understand what type of batted ball occurs more commonly with each direction. Dominikk (2018a) explored how batted-ball direction interacts with launch angle, showing that inside pitches are more likely to be pulled with higher launch angles. This relationship indicates that hitters do not simply choose to pull or go opposite field on a whim but instead react to pitch characteristics with specific directional tendencies.
In another study, Dominikk (2018b) also examined elevation mechanics and how certain pitch types and locations can support a hitter’s ability to elevate the ball. The study linked swing path adjustments to pitch types, with different results depending on whether the pitch was fast, breaking, or off-speed. The type of pitch thus directly influences both the vertical and horizontal outcomes of a batted ball. These findings are reinforced by Sheinin (2017), who discussed how the recent emphasis on launch angle has forced hitters to refine their approach against specific pitch types. Many hitters now tailor their swings to maximize damage on particular pitch profiles, especially when anticipating fastballs in predictable counts.
All three studies suggest that pitch type and location heavily influence not only swing decisions but also the eventual direction of contact. By tailoring their mechanics and timing to different pitch types, hitters increase their chances of successfully pulling or going opposite field depending on the situation. Hitters have tended to show strategy about what pitch type or location they are intending to hit when in favorable counts.
2.4 Count-Based Hitting
A hitter’s approach at the plate often varies depending on the count of balls and strikes. As the count progresses, hitters must adapt their strategies to optimize their chances of reaching base or producing a well hit ball. Recent research has shed light on how batters should perform in different favorable or non-favorable counts for the hitter.
Petriello (2021) examined how hitters shift their approach depending on the count, emphasizing changes in swing intent, bat path, and pitch selection. In favorable counts (e.g., 2-0, 3-1), hitters were more likely to pull the ball with intent to do damage. In contrast, two-strike counts induced shorter swings and more opposite-field contact, highlighting a strategic shift toward bat control and contact-oriented mechanics. Inherently, this makes sense because in favorable counts, hitters are looking to damage with pitches they can crush out front, leading to a pulled hit. On the flip side, when hitters are behind in counts, they are trying to get the ball deeper in the zone so they can recognize the pitch and hit it to the opposite field.
It is important for hitters to stick to the same strategy throughout their careers depending on the count according to Jackson (2024). He examined the idea of swinging at a pitch and whether it was more beneficial for hitters or pitchers. Of course, if hitters swing at the first pitch more often, it will save pitches for the pitcher allowing them to go deeper in the game. However, he found that hitters who keep the same aggressive swing rates at first pitches have the most success from year to year in terms of outcome stats.
In other light, Ben Perry (2022) provided a deeper look into specific counts, such as 3-2, where hitters are statistically more likely to expand their zone and protect the plate. His analysis revealed a surge in opposite-field contact and ground ball rate in full-count situations, implying a reactive approach aimed at survival rather than power. This is similar to all other two strike counts in which the hitter appears to be protecting the plate and hitting the ball deeper in the zone.
Continuing, Mark Toma (2021) addressed that hitters tend to over-swing when they are in a 3-2 count as they swing at pitches outside the strike zone. When he adjusted the tactics of hitters to the same of those in a 3-1 count, he found that the teams would score an average of just under 33 runs in a season. He concluded that hitters swinging at more pitches can be attributed likely to fan pressure and the idea that they can strike out on a close call because there are 2 strikes.
Building on previous research, K. D. (2018) visualized heat maps based on swing and contact tendencies across various pitch counts. The results revealed that hitters make distinct directional choices based on the leverage of the situation. These tendencies are tied to expected pitch location and type, reinforcing the idea that count influences not just swing decisions, but where the ball is hit on the field.
Each article suggests that hitters are more aggressive in terms of hitting the ball out front towards the pull side when they are ahead in counts because they can get away with swinging and missing at a pitch. Whereas with two strikes, a hitter must protect at the plate which means that they hit the fastball and adjust for offspeed. In this situation, they are more likely to hit the ball deeper in the zone, resulting in a batted ball to the opposite field. Overall, the relationship between count and directional hitting does play a degree in understanding which direction the hitter hits the ball and whether or not that results in success.
2.5 Hitting the Ball the Correct Direction
What does hitting the ball the right way really mean? Theoretically, hitting a ball the correct direction would mean the ball is being hit in the direction that results in the best batted ball metrics such as exit speed, launch angle and spin on the ball. Another way hitters can hit the ball the correct direction is by producing a base hit. This is dependent on many random factors making it impossible to predict the outcome of a batted ball as there are infinite possibilties. This is why we avoid attempting to predict the outcome of a single batted-ball and rather look
Backs this up in an article where he dives into whether or not pulling the ball is more beneficial towards the hitter. He examines the rate in which the ball is batted each way and how they are all primarily pretty close. He states this makes sense from a mechanical perspective because a hitter is trained to stay inside the baseball and hit it where it’s pitched. This means that to hit an outside pitch, the hitter must let the ball travel deep into the zone which results in more fly balls. When the ball is closer to the hitter, the ideal contact point moves closer to the pitcher and the likelihood of front side leakage occurs which then results in a rollover to the left side. So, this means that the ideal contact points are based on where they should hit it, but it does still lead to poor outcomes when the hitter fails to hit the ball squarely or if they leak to the wrong area.
So, determining the most effective direction to hit the ball is critical for optimizing offensive outcomes. In an article Sawchik (2017), Dr. Alan Nathan found that pulled fly balls tend to yield higher slugging percentages compared to balls hit to center or the opposite field. This suggests that targeting the pull side can produce more extra-base hits because hitters are hitting the ball out front which means they have generated more force from their swing into the ball. When hitters hit the ball out front and in the air, it results in more home runs and extra base hits to the gaps, therefore resulting in a higher slugging percentage.
In theory, hitting the ball the correct direction is a metaphorical phrase because there is no correct direction. The corrrect direction simply means whichever direction has more success and while we can determine which areas see more success, there is no way to accurately state that hitting the ball a certain direction will be more successful in every instance due to the number of random factors. However, there is reason to believe that hitting the ball a certain direction based on some simple factors can lead to success.
2.6 Pull Side vs. Opposite Field Hitting
The ability or choice to pull the ball versus hitting the ball to the opposite field is often dictated by some general factors such as pitch location, pitch type and hitter intent. Hitting the ball to the pull side more often can be stylistic preferences but strategic deciosions influenced by biomechanics, timing and awareness play a big role in which way the ball is hit.
When hitting a pitch in certain locations, there is evidence that hitters only have success when they hit the ball a certain direction. If they try to do the opposite of “where it should be hit”, hitters will see a drop in success. Jones (n.d.) explores the challenge of hitting inside pitches, a scenario that typically favors pull-side hitting. He emphasizes that successfully turning on these pitches requires a compact, explosive swing and early contact. Hitters who are behind on an inside pitch and hit it to the opposite field, tend to be jammed causing the ball to hit below the barrel which resultes in a very weak batted ball. Players who get around on an inside pitch, can generate significant power to the pull side, a valuable asset especially in hitter-friendly ballparks with shorter distances down the lines.
It is important to also take a look at the biomechanics of how the body reacts and at what angles certain pitches are caught by the bat. Blengino (2014) complicates the narrative by noting that while pulling the ball, especially in the air, often leads to better results, it requires clean mechanics and discipline. Many hitters struggle when they attempt to pull pitches they shouldn’t, resulting in weak ground balls which are referred to as rollovers. He argues that success in pulling comes down to making good swing decisions and capitalizing on the right pitch location.
Similar research from Clemens (2024) adds a data-driven layer, using Statcast metrics from 2021–2023 to identify trends in pull-side effectiveness. He finds that hitters who pull fly balls generate the highest exit velocities and wOBA. However, Clemens also observes that hitters with a more balanced approach often post better expected outcomes (xwOBA), particularly when adjusting to non-fastballs and pitches on the outer half meaning that they go the other way as well because they aren’t pressing to pull everything.
If hitters try to pull the ball everytime, the pitcher will eventually catch on and only throw offspeed pitches on the outer half of the plate. To avoid this, hitters must adapt and hit the ball the other way when the pitcher tests them in this situation. Brewer (2014) explains that while pulling offers power, the ability to wait and drive the ball the other way adds a layer of adaptability, especially against elite pitching. Late contact on outside pitches is essential for effective opposite-field hitting and is often a hallmark of disciplined hitters.
In different situations, it is important to analyze the situation that a hitter is in. This relates directly to the biomechanical approach of hitting the ball a certain way. Gelinas (1988) provides a biomechanical foundation for these differences, showing that centerfield hits tend to travel the farthest due to backspin and high initial velocity. Pull-side hits often feature more sidespin, reducing distance slightly, while opposite-field hits usually come off the bat with less velocity and higher spin rates, limiting carry. The findings suggest that while pulling maximizes power potential, field dimensions and pitch location should influence a hitter’s directional intent.
So, pulling the ball certainly can increase a hitter’s power however, if they try to pull every pitch, their success at the plate will see a decline because some pitches aren’t meant to be pulled. The same goes for hitting the ball the opposite way. Strategic flexibility, combined with mechanics and pitch recognition, enables hitters to maximize their offensive performance when determining which way a pitch should be hit.
2.7 Launch Angle
Finally, it is important to understand that no matter which way the ball is hit, launch angle (and exit velocity), play a major role in determining the success that a hitter will have. It is impossible to predict the outcome of a hit due to not knowing where the defense will align each pitch and other factors such as the weather, etc. However, exploring the launch angle of a batted ball offers a bridge between directional hitting and the success a hitter will have with each batted ball.
Launch angle, defined as the vertical angle at which the ball leaves the bat. According to Nathan (2015), launch angle plays a central role in determining the likelihood of a batted ball becoming a hit. Nathan identifies an optimal range, generally between 10 and 30 degrees, for maximizing extra-base hits and home runs. Balls hit below this threshold often result in groundouts, while those hit at too steep an angle are more likely to be flyouts or popups.
Kagan (2014) complements this perspective with a more tactical view, noting that hitters can manipulate their swing paths to generate specific launch angles depending on game context and pitch type. He explains that the advent of high-speed cameras and Statcast data has allowed teams to coach players into optimizing these metrics for performance. For instance, a hitter might alter their approach with two strikes, sacrificing launch angle for more contact-oriented swings.
Since roughly 2015, launch angle has become a hot topic around baseball with many believing that higher average launch angles are important because they lead to more extra base hits. Petriello (2021) elaborates on this shift, showing that MLB hitters began actively optimizing their swings around 2015 to elevate the ball more consistently. His analysis of batted ball distributions confirms a league-wide rise in average launch angle, suggesting a systematic change in hitting philosophy. However, Petriello also warns that chasing launch angle can lead to increased strikeout rates if hitters sacrifice contact for loft.
However, not all players benefit from a higher launch angle because they don’t hit the ball as hard. When the ball isn’t hit as hard but has the same launch angle, a home run for one player might be a routine flyout for another player with less power. Blengino (2015) echoes this concern, emphasizing that not all hitters benefit equally from elevating the ball. Players with below-average bat speed or poor pitch recognition may struggle when trying to artificially lift the ball, leading to weak fly balls and higher whiff rates. His work underscores that swing optimization must be individualized.
In conclusion, launch angle is a pivotal component of modern hitting, offering a lens through which to understand batted ball effectiveness. However, like pull-side hitting, its benefits are contingent on context, hitter skill, and pitch characteristics. When integrated thoughtfully, launch angle optimization can enhance offensive performance, but indiscriminate pursuit of loft can be detrimental. The literature suggests that the best hitters understand when and how to elevate and which way to try to hit the ball, adapting their approach to both the situation and their own physical tools resulting in the best outcomes.
3. Data Collection
All statistical modeling and data collection for this study was completed using R. The primary source of data was pulled using the baseballr package, (Petti & Gilani, 2016/2024) which allows users to scrape Statcast play-by-play data. The scraped data included seasons 2015 through 2024.
Each observation includes detailed information such as pitch type, pitch location, batted ball location, launch metrics and play outcomes. To isolate the relationship between pitch location and batted ball performance, batted balls in play were the only pitches included in the final dataset, resulting in 977,416 instances. This ensured that the analysis focused solely on how pitch characteristics affect batted-ball direction and expected performance, rather than non-contact outcomes.
3.1 Data Preparation
When preparing the dataset for analysis, several steps were conducted in R. The data was cleaned by removing all observations in which there was missing data for: field coordinates, batted ball type, and strike zone location. To further reduce the noise, batted balls with an exit velocity below 30 mph or a vertical distance less than 20 feet were removed because these events typically represent bunts or half-swings, which could skew outcome-based analyses.
Next, the dataset was adjusted to match standard field coordinates for visualization purposes. The x-coordinate was centered using the formula: x = hc_x - 125.42. The y-coordinate was flipped and centered with: y = 198.27 - hc_y. These transformations align Statcast batted ball data with typical baseball field visualizations for spray charts (Petti & Gilani, 2016/2024). After correctly converting the x-coordinates, the Left-Handed Hitter x-coordinates were flipped to match those of the Right-Handed Hitters. This was done by simply multipluing each coordinate by -1. This was done to display disparity throughout the league rather than differences between the handedness of each hitter.
Pitch locations were binned into categorical zones within the strike zone of Inside, Middle, and Outside, batter’s handedness was accounted for. Each zone measured an equal 0.48-feet, with additional padding to account for pitches just off the plate. This allowed for better analysis of how pitch location influences batted ball direction throughout visualizations rather than modeling. Modeling used the actual x-coordinates rather than the binned zones to ensure more clarity. Figure 1 displays the three zones that were formed using Javier Baez’s pitch chart as a hitter in 2024.
Figure 1 – Pitch Location Variable, Batter’s View
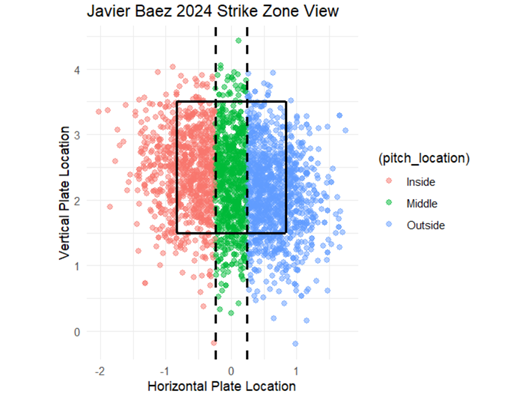
This chart displays what the pitch location bins consist of for each hitter. This example shows the zone of batted balls for Javier Baez during the 2024 season.
Next, to replicate a “spray direction”, a new variable of Batted Ball Direction, was created by translating batted ball locations into three slope-based directional bins: Pull, Middle, and Opposite field. Using the tangent function, slopes were defined to assign each batted ball to one of the three directional zones relative to batter handedness. This allowed for consistent directional classification across thousands of observations. The spray zones for right-handed hitters can be seen in Figure 2.
Figure 2 – Right-Handed Batters in 2024 Spray Chart
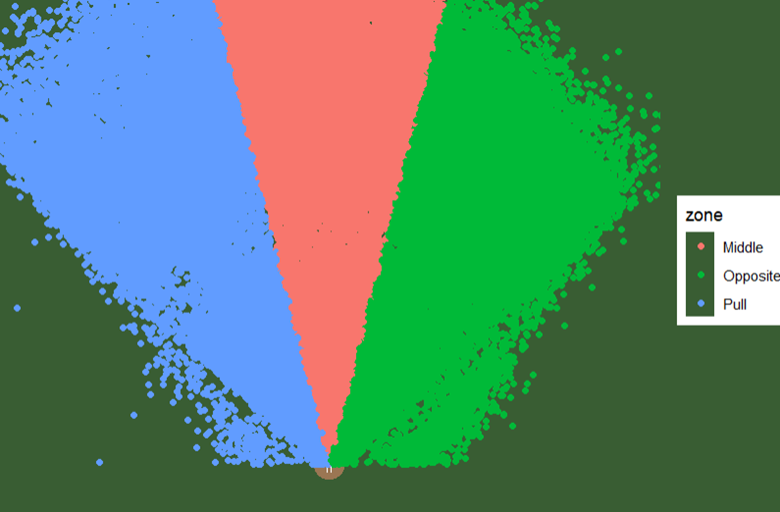
The figure displays the distribution of all batted balls from RHH during the 2024 season categorized into “Pull”, “Middle”, and “Opposite”.
Next, a Chi-Square test of independence was conducted using the dummy-coded location and zone variables to assess relationships between pitch location and spray direction. This test determined whether the horizontal pitch location (Inside, Middle, Outside) was statistically associated with the spray direction (Pull, Middle, Opposite) of each batted ball.
3.2 Modeling Approach
To evaluate how pitch characteristics effect batted ball direction and expected performance, two primary modeling approaches were used: Generalized Additive Modeling (GAM) and XGBoost machine learning modeling. These models were trained and tested using data from the 2015–2024 Statcast dataset described above.
The first modeling approach consisted of a GAM approach. This was chosen due to the flexibility in modeling nonlinear relationships between the predictor variable, pitch location, and a response variable, horizontal spray angle of each batted ball. The model used smooth functions to discover if pitch location influences whether a ball is pulled, hit up the middle, or hit to the opposite field. The results were then displayed on a faceted heatmap.
A second GAM was fit to predict batted ball direction based on pitch type. The model was built to show the corrrelation between both pitch movement/pitch velocity and batted ball location. The results were then displayed as a bar chart showing the predicted horizontal spray direction by pitch.
Next, nonlinear relationships were accounted for by building an XGBoost model to predict variable xwOBA. The data was split into training and test sets, and the XGBoost model was run using a series of hyperparameters to stop overfitting. RMSE was used to evaluate performance during training, and cross-validation helped to tune the model’s parameters. To replicate Fangraphs xwOBA, bounds were set between 0 and 2.1 to ensure that no illegitimate results were produced. The model was used to analyze if pulling a pitch impacted xwOBA success based on pitch location.
To investigate the relationship between overall pull percentage and xwOBA, a linear regression model was created to quantify the effect of pull percentage on xwOBA for all hitters.
4. Results
The analysis of spray direction for both left and right-handed hitters on outside pitches revealed insights that challenge traditional baseball narratives. First, Figure 3 examines whether hitters hit outside pitches to the opposite field. Contrary to this expectation, the data shows that left-handed hitters pull the ball on outside pitches 6.6% more frequently than they hit it to the opposite field on outside pitches. This highlights a strong intent to pull the ball. Right-handed hitters, on the other hand, tend to hit outside pitches to the opposite field more often than pulling an outside pitch, doing so 1.6% more often. While this trend aligns with the narrative to a slight extent, it still indicates a preference for pulling the ball.
Figure 3 – Spray Direction on Outside Pitches 2015-2024
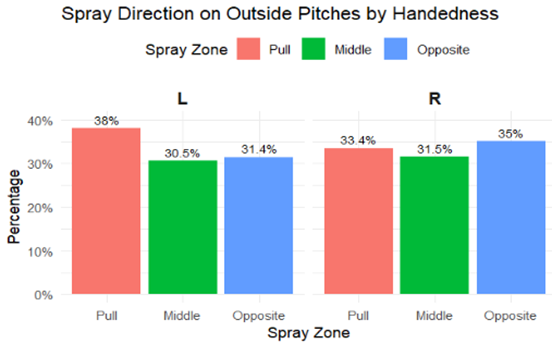
This chart displays the Batted Ball Direction in which the ball is hit to. This only displays the trend when an outside pitch is thrown.
Continuing, Figure 4 shows the trend in pull percentages across the league from 2017 to 2024 were inputted into a line graph as can be seen in Figure 4 below. In 2017, the league-wide pull percentage was 33.7%, and it experienced a slight increase over the following years. In 2020 and 2021, there was slight regression in pull percentage however, since 2017 there has been an increase of 3.1% in pull percentage on all batted balls.
Figure 4 – Yearly Pull Percentage Rates 2017 to 2024
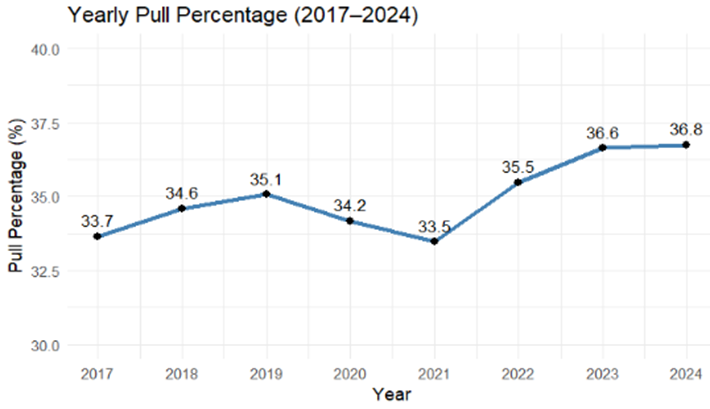
This chart displays the uptick in the percentage of batted balls being hit to the pull side by both right and left handedright- and left-handed hitters.
Next, to examine how pitch location causes batters to pull the ball, correlations were plotted between different pitch types for the percentage of inside pitches and the pull percentage. To match the narrative of hitters hitting the ball the way it came would suggest that, the percentage of inside pitches would match the percentage of those pitches being pulled, but the data suggests another narrativetells another story. The chart shows that all pitches thrown in 2024 were pulled at a higher rate than they were thrown in the inside part of the strike zone. This excludes Sinkers which are thrown inside 40.6% of the time and only pulled 40% of the time as well as Four -Seam Fastballs which are pulled slightly less than they are thrown inside. However, Four -Seam Fastballs and Sinkers are nearly identical in the percentage of pitches thrown inside and the pull percentage of all pitches likely because of the higher velocities. All other pitches are pulled at rates of nearly 20% more than they are thrown inside as can be seen in Figure 5.
Figure 5 – Percentage of Pitches by Pitch Type vs Pull Pct of Each Pitch
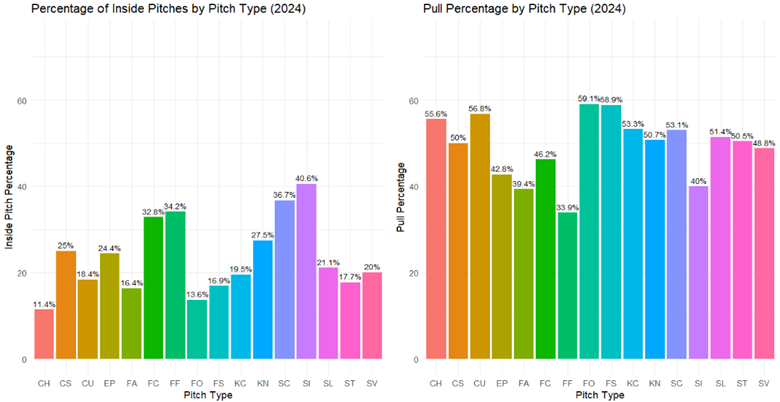
The two charts above display the percentage of inside pitches by each pitch type thrown in 2024 and the percentage that each pitch type is pulled during the 2024 season.
Next, these results imply that hitters are pulling the ball more often than would be expected based on the pitch location. The question that arises is whether pulling the ball in these instances results in success.
Figure 6 – Batted Ball Direction by Pitch Location 2024
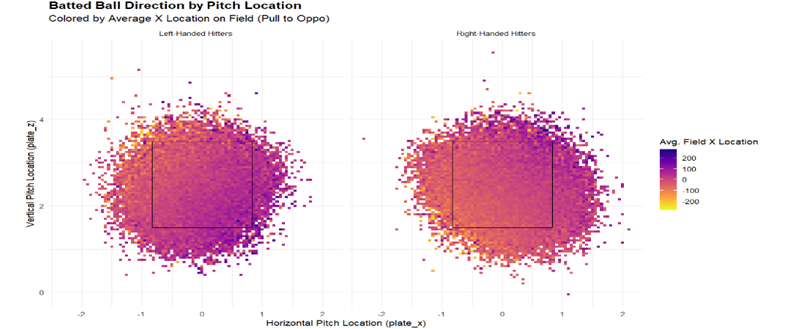
This displays each batted ball by both left and right handed hitters d uring 2024. It displays a strike zone with the pitch coordinates and is colored based on the direction in which the ball was hit.
Figure 6 visualizes batted ball direction for both left and right-handed hitters in 2024, based on pitch location. The strike zone is shown with color codeding indicating bythe direction of the batted ball. The chart is densely populated with data points, making it hard to conclude whether or not hitters are pulling the ball more than they should be.
To assess the relationship between pitch location and batted ball direction, a chi-squared test was performed. The results of the test indicated a highly significant relationship between the two variables with a p-value < 2.2e-16. The extremely low p-value allows a rejection of the null hypothesis, supportsing the conclusion that pitch location and batted ball direction are not independent. This suggests that pitch location plays a crucial role in determining whether a batter pulls the ball or hits it to the opposite field.
Figure 7 – GAM Predicted Batted Ball Direction
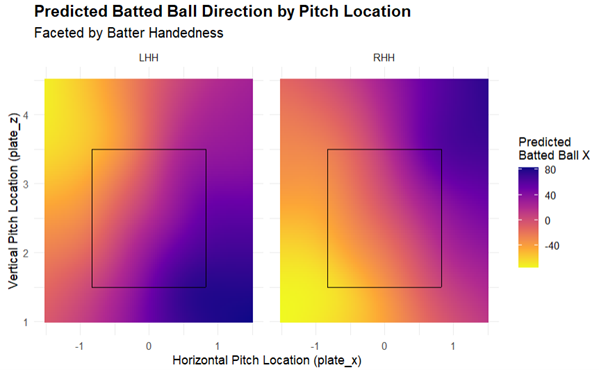
The chart displays the Predicted Batted Ball Direction by Pitch Location for both right-handed and left-handed hitters. The predictions come from the GAM.
Next, the two models for both RHH and LHH predicted the batted ball direction based on the pitch location. The results showed that the predicted batted ball directions closely follow the narrative, with the difference between right and left-handed hitters being minimal. Both are nearly identical to perfect mirror images of each other, although they are flipped of course in Figure 7 above. Right-handed hitters tend to hit high and outside pitches to right field while left-handed hitters hit low and inside balls to left field.
To explore this relationship further, a separate GAM was run to investigate the correlation between predicted batted ball location and pitch type. The results can be seen in Figure 8.
Figure 8 – Predicted Hit Location vs. Pitch Type (Right-handed Hitters
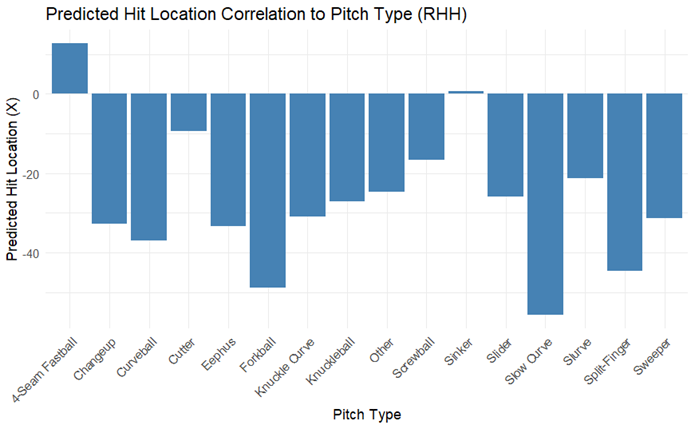
This chart displays the predicted hit location results from the GAM. It displays the predicted hit location of each Type of Pitch.
The GAM results for right-handed hitters indicate that almost all pitches are pulled, with the exception of four-seam fastballs and sinkers, which tend to be hit to the opposite field. This suggests that right-handed hitters are more inclined to pull nearly every pitch , which is why the average batted ball location for each pitch type leans toward the pull side. This is similar to Figure 5 which suggests the same.
Now that we know hitters tend to pull the ball more often, this begs the question: Does pulling the ball more frequently result in more success? The answer to this question lies in the xwOBA of each batted ball and whether or not it is higher based on the direction in which it is hit.
Within the dataset, there was no solidified There was no xwOBA metric provided in the dataset, so the goal was to replicate this statistic by building an XGBoost model. The first XGBoost model was used to create the xwOBA metric, which was then compared to actual wOBA for the 2024 season to measure accuracy. The results demonstrated that the xwOBA values closely aligned with actual wOBA, confirming the model’s predictive accuracy.
Figure 9 – Distribution of xwOBA minus wOBA during the 2024 season
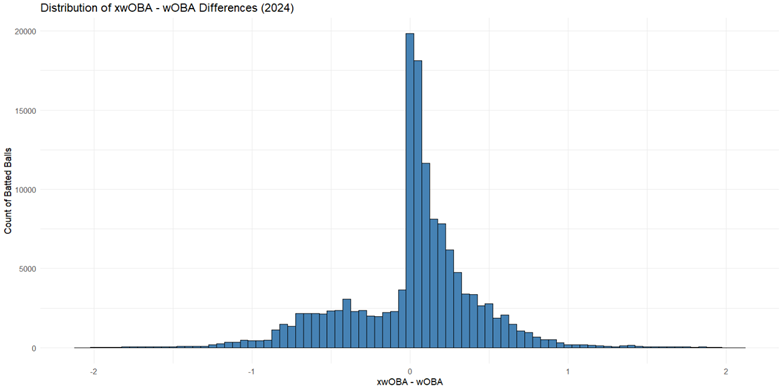
The chart displays the Distribution of xwOBA minus wOBA during the 2024 season.
Figure 9 illustrates that the predicted xwOBA values are very close to the actual wOBA, but the model does not achieve perfect alignment, which is expected. xwOBA is designed to be a prediction of a hitter’s performance that is not entirely outcome-based but still incorporates outcome data.
Figure 10 – xwOBA vs Spray Angle by Pitch Location
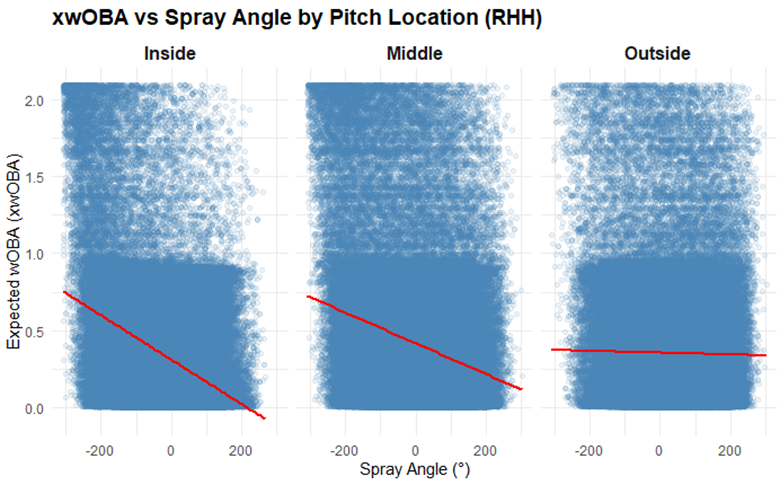
This chart examines the correlation between xwOBA and the Spray Angle for each pitch location bin. The correlation can be seen on the trend line or with the slope at the top of each graph.
Figure 10 explores the relationship between xwOBA and the horizontal direction of batted balls, by pitch location for only right-handed hitters. The model indicates that on inside pitches, pulled batted balls tend to yield the highest xwOBA when pulled more dramaticallyvalues. Pitches in the middle of the strike zone also show a strongly positive correlation with increased xwOBA as they are pulled.
Interestingly, outside pitches show a minor positive correlation with pulling the ball, suggesting that hitting outside pitches to the pull side may not be as detrimental as previously thought. The next step is to figure out where the xwOBA drops in success rate the further into the outside part of the zone the pitch location goes.
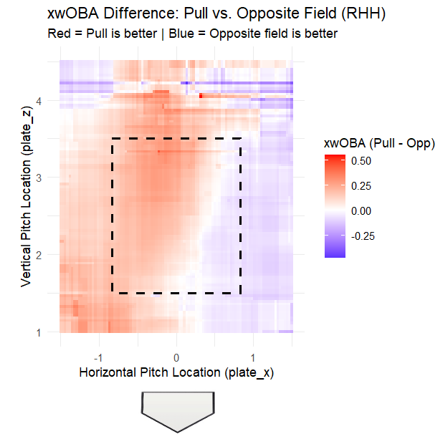
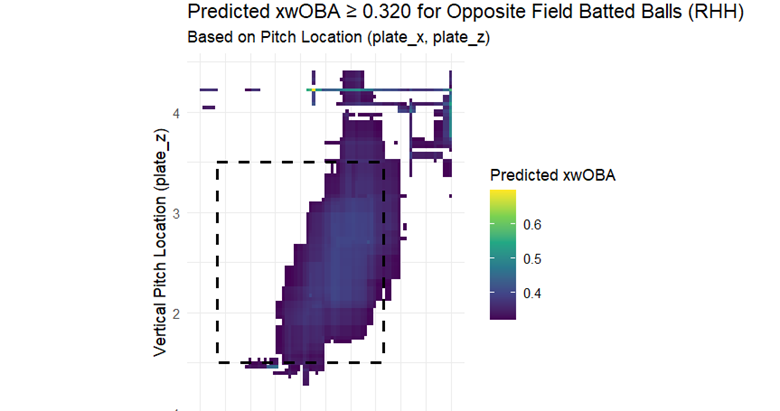
Figure 11 – Areas of Predicted xwOBA Over .320 for Pulled Batted Balls as a Right-Handed Hitter
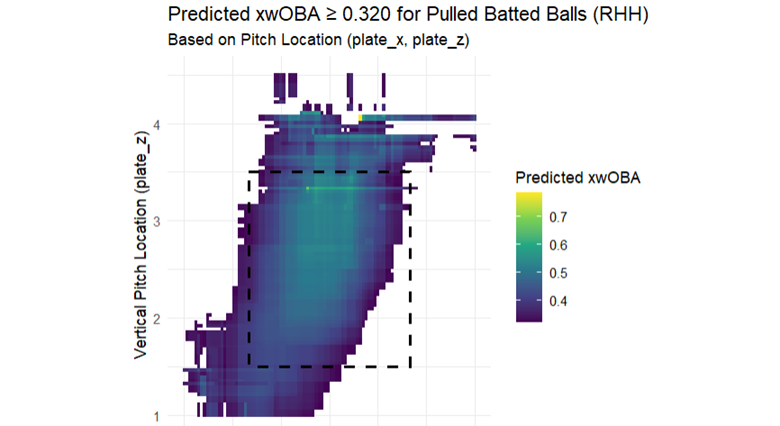
This chart displays the strike zone for right-handed hitters. The shaded areas are areas in which the ball should be pulled because there is an xwOBA over .320 meaning that it is above average in success levels.
Next, the XGBoost model visualizes the predicted xwOBA for pulled batted balls, highlighting areas where it is greater than or equal to 0.320 . These shaded areas represent locations in the strike zone where pulling the ball is expected to result in above-average performance. The inside and middle zones, as well as some of the outside zone, are shaded, indicating that pulling the ball in these areas leads to higher expected performance. The xwOBA grows higher the closer the pitch is to the middle of the zone and near the top of the zone. This show that pulling the ball more often results in high xwOBA. Does this mean hitters should never hit the ball to opposite field even where the zones are shaded?
Figure 12 – Areas of Predicted xwOBA Over .320 for Balls Hit to the Opposite Field as a Right-Handed Hitter
This chart displays the strike zone for right-handed hitters. The shaded areas are areas in which the ball should be hit to opposite field because there is an xwOBA over .320 meaning that it is above average in success levels.
As can be seen in Figure 12, the answer is no.: Iit does still makes sense to hit the ball to the opposite field when seeing for certain pitch locations. This chart displays where the XGBoost model where suggests balls should be hit to the opposite field because of an xwOBA over .320. The shaded regions suggest above-average performance when hitting to the opposite field, but this zone is much smaller than the pull zone., Notably, it excludesing the inside part of the plate, which supports the notion that pulling the ball inside pitches tends to yield better results. However, just because the xwOBA is over .320 doesn’t mean that it would make the most sense to hit it to opposite field. Determining the way to hit the ball would come by comparing the two predicted outcomes.
Figure 13 – xwOBA Differences in Pulled vs. Opposite Field Hits for Right-Handed Hitters
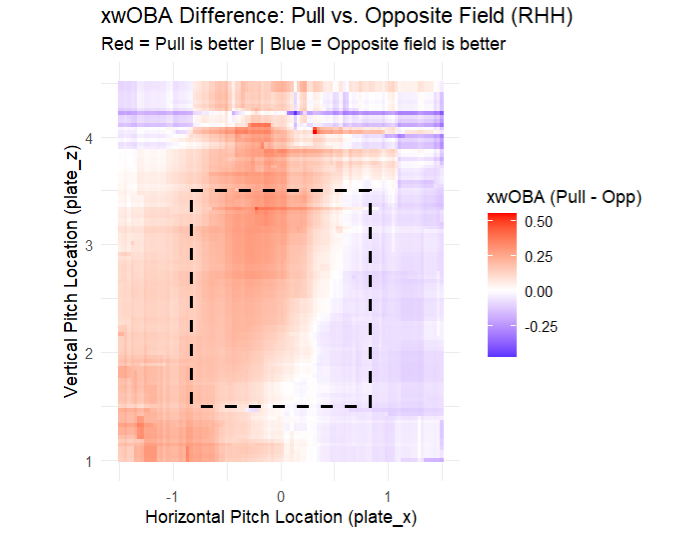
The red areas indicate zones where pulling the ball is most advantageous, while the blue areas highlight where hitting to the opposite field is the better option for maximizing expected performance.
Finally, Figure 13 models shows the difference between pulled vs. opposite field hitting based on xwOBA and pitch location. It is calculated by subtracting the pull xwOBA success from the opposite field success at every x and y coordinate. This displays that pulling the ball in most of the zone other than all but the furthest outside part of the zone makes sense for the highest xwOBA.
5. Discussion
This study set out to explore how pitch location and pitch type impact batted ball direction, focusing on whether batters were more likely to pull the ball or hit it to the opposite field. Using both Generalized Additive Models and XGBoost models, we found clear evidence that where a pitch is located greatly shapes the direction it’s hit. Right-handed hitters, for example, showed a strong tendency to pull pitches thrown inside, while outside pitches were more often driven to the opposite field.
However, it is certainly important to note that hitters have begun to pull the ball much more often and in situations that we may not have liked to see in the past. Research showed that hitters should be pulling the ball more often though and this is a good thing. When batters pull the ball for more than half of the strike zone, they have an xwOBA that is above average.
One of the more interesting takeaways is how these findings connect to newly released hitting philosophies. Recent MLB research emphasizes that the optimal point of contact, especially for power, is about 36 inches out in front of the hitter’s body. These results complement this by showing that batters who are able to get the barrel out early on inside pitches are much more likely to pull the ball effectively, maximizing their ability to hit for power. Meanwhile, pitches further away, where hitters naturally make contact later, are hit toward center or the opposite field. This reinforces the growing belief in player development that understanding when and where contact occurs is just as important as swing mechanics themselves.
Pitch type also played a meaningful role. Fastballs tended to produce more opposite-field hits, likely because of their velocity forcing hitters to stay inside the ball longer. Breaking pitches, on the other hand, were pulled more often, likely because their slower speed giving hitters extra time to adjust and get the barrel out in front. These models, alongside visualizations like spray charts, made these tendencies easy to spot.
The chi-squared test results confirmed that pitch location and batted ball direction are strongly linked. When pitchers miss their spots, the likelihood of hard-hit, pulled contact goes up dramatically, which has major implications for both offensive production and defensive planning.
5.1 Implications for Baseball Strategy
The findings of this study reinforce a growing trend in Major League Baseball: hitters are increasingly being coached to attack pitches out in front of the plate to maximize power and consistency, especially on pitches they can pull. Teams should completely move away from traditional approaches that emphasizes “using all fields.” Instead, they should encourage players to prioritize early, aggressive contact, particularly against pitches over the inside and middle of the plate. The same thing goes for off-speed pitches.
From an analytics perspective, these findings should open MLB teams’ minds to doing more individualized research into their players’ swing profiles and tendencies. Rather than relying solely on general league-wide trends, organizations should be creating specific reports for every hitter that detail where each player has the most success based on spray angle, pitch location, and pitch type. They should also be evaluating how effective a hitter is when they pull the ball, stay up the middle, or go to the opposite field from every area of the strike zone. This could also be done for pitch type. The goal would be to determine which areas of the strike zone a hitter has success hitting the ball certain directions rather than just having a hitters overall pitch splits. They could really dive into where in the zone a hitter has success with each pitch and where the hitter tends to hit the ball.
A team could eventually do this for all players in the league and tailer defensive shifts to each pitch for different batters throughout each game. This would be tough to implement because there would be so many moving pieces, but it would be quite interesting to see.
5.2 Limitations
Despite the strength of the findings, a few limitations are worth mentioning. First, the study only considered pitches that resulted in balls in play, leaving out swings and misses as well as poorly hit balls. This could be leaving out a major underlying issue that doesn’t show up in the data because it isn’t being accounted for originally. Including those might have added even more context about how hitters respond to different locations.
Another limitation is that the success metric was quite simple. A better metric would have more biometric data about the type of batted ball itself rather than the outcome based data of wOBA. This is why launch angle and exit velocity were included however, there is much more data that could be included to make the metric better. If a team were to take their private biometric data, they could make a much more accurate and less outcome-based metric to evaluate a players success based on the batted ball direction.
Finally, expanding beyond traditional success metrics like batting average or slugging percentage to incorporate new measures such as expected win percentage per swing or expected run contribution based on spray angle could provide a more complete and modern understanding of hitter effectiveness.
6. Further Steps
When determining the optimal direction for a batted ball, it is important to recognize that pitch location is only one of many factors influencing a batted-ball outcome. While this thesis has focused primarily on pitch location-based tendencies, hitters operate within a much more complex environment where variables such as pitch type, count, game situation, and even defensive alignments shape outcomes. Future research should therefore expand beyond pitch location to capture the interaction of these additional factors with directional hitting.
6.1 Pitch Types
Different pitch types create distinct challenges that affect both the swing path and the probability of success to each field. Fastballs, with higher velocity and straighter movement, often encourage pull-side contact (Fortenbaugh, 2011), whereas breaking pitches with sweeping horizontal movement may induce more opposite-field contact, even if located in similar zones (Janish, 2006). Modeling pitch type as a predictor would allow for better understanding of how hitters adapt their directional approach. For instance, incorporating movement metrics (horizontal and vertical break) alongside location in GAM or XGBoost models could uncover nonlinear relationships between pitch characteristics and spray direction that are not visible when analyzing pitch location alone.
6.2 Different Count Situations
Count-based hitting remains one of the most important determinants of approach. With two strikes, hitters often shorten their swings, adjust their timing, and emphasize contact over power, which can change directional outcomes. A location that might normally produce a pulled ball in a neutral count could instead be driven to the opposite field in a two-strike situation. By controlling for count, future models could help clarify whether directionality is a product of pitch location itself or the hitter’s situational adjustment. XGBoost, in particular, could capture behavioral shifts occurring only in two-strike counts that would otherwise be missed.
6.3 Game Situation
Contextual factors, such as the score of the game, inning, number of outs, and presence of baserunners, exert a strong influence on hitter behavior. Situational hitting often requires prioritizing run advancement over maximizing exit velocity or launch angle. For example, with a runner on second base and no outs, hitters may deliberately attempt to hit to the right side (opposite field) to advance the runner, even if that reduces their own expected weighted on-base average (NCSU). Incorporating a situational variable into the modeling would allow for a more realistic representation of hitting decisions. Such at-bats could also be excluded from analyses seeking to measure the intrinsic relationship between pitch location and optimal batted-ball direction. In this sense, situational hitting introduces a form of bias, since the hitter is deliberately sacrificing personal performance metrics to fulfill a team-oriented objective.
Future research should move toward integrating pitch type, count, and game situation into determining the best batted-ball outcome for each pitch location. Doing so will provide a more complete understanding of hitting behavior and improve both predictive accuracy along with the practical relevance of the findings.
7. Conclusion
The study provides evidence that pitch location plays a critical role in batted ball direction outcomes. By using statistical modeling, machine learning and visualization techniques, the findings were able to display the change in baseball about why hitters are pulling the ball more often. They are no longer trying to “go with the pitch” but rather pull the ball because of the success it brings.
The insights should encourage teams to move past old narratives and begin developing individualized reports for each player and determining where they should be hitting each pitch and the ideal contact points. By customizing reports for each player, organizations will be able to learn more about not only how to help their own hitters approaches, but they can help with pitch sequencing and defensive alignment.
Overall, this study, provides a strong foundation for future research about the relationship between pitch location and batted ball success at the MLB level. As player development and baseball strategies evolve, further research will be needed to help organizations determine what to teach their hitters about hitting the ball a certain way. By embracing the new idea however, of pulling the ball more often even when the pitch is in the outside part of the zone, teams will find more success than if they “hit the ball where it came from.”