
Progressive Field ‘Wind-Tunnel’
Published:
Exploring Home Run Rates and Comparing Actual vs. Predicted Hit Distances at Progressive Field in 2024
Recent Cleveland Rennovations
During the 2023-2024 offseason, the Cleveland Guardians decided to make multiple renovations to Progressive Field. The renovations took place in 5 different areas throughout the stadium. The locations included beyond right field, down the left field line and directly behind home plate. In right field, they added the ‘Right Field Paul Davis Pennant District’ which features a new open-air, group outing area with concession stands. Previously, there had been another deck of seats and a wall blocking off any airflow to the concession stands. With the new renovations however, there appears to be much more airflow through the right field wall.
To begin the first half of the 2024 season, the new panoramic angles in right field have offered a view to one of the most high powered offenses in the league. Through Cleveland’s first 81 games, they have the 4th highest scoring offense in the league while averaging 5 runs per game. This has helped propel the team to the best record in the league at 52-29. On the flip side, Cleveland’s pitching is allowing the 6th most home runs per 9 innings at home this season. High offensive numbers for all teams playing in Cleveland has highlighted an underlying question that has been trending lately: Have Progressive Field renovations created a home run ‘wind-tunnel’?.
Determining Whether or Not a ‘Wind-Tunnel’ Exists
An increase in offensive production and home run numbers at Progressive Field during the 2024 season has sparked speculation about the presence of a ‘wind-tunnel’ effect. To determine whether this phenomenon is occurring or if the changes are simply due to the Guardians’ performance, I decided to conduct further research.
After reading multiple articles on predicting the distance of a batted baseball by Alan Nathan, Jim Albert, Joe Noga, and another by Cameron Grove, I attempted to replicate some of their ideas and draw my own conclusions.
Before we dive in, it must be noted that the “actual home run rate” used in each model was slightly higher than it should have been due to a small number of missing values for launch speed and launch angles within our data. This discrepancy caused a slight difference from the actual home run rate in real time.
Comparing Actual Home Run Rates
Similar to the research conducted by Alan Nathan and Jim Albert, this analysis begins by comparing home run rates across multiple years at Progressive Field. To start, let’s examine how the home run rate at Progressive Field has compared to the rest of MLB over the past few years.
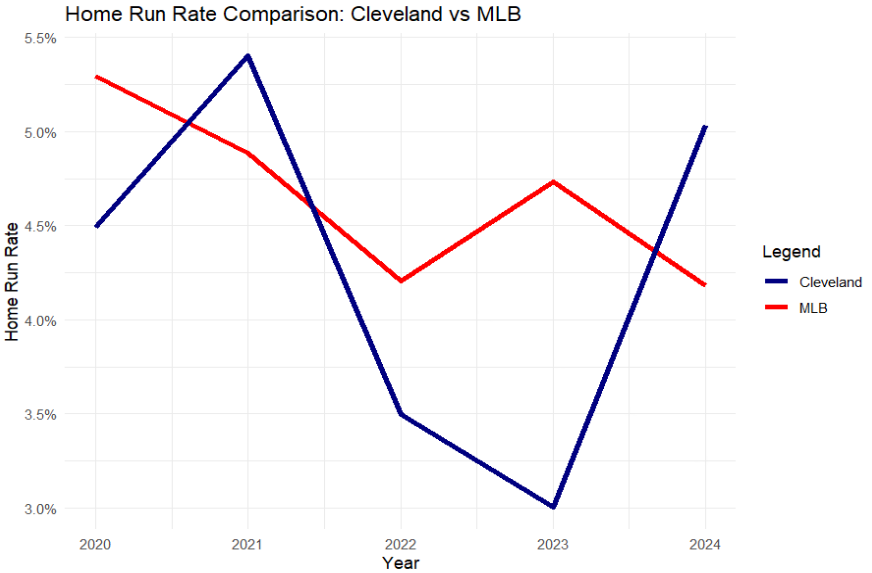
The chart shows the Home Run Rate for all balls in play (BIP) from 2020-2024 with each BIP correlating to the responding year. The Cleveland rate includes all BIP at Progressive Field, while the MLB rate covers all other parks. Both the Guardians' and opposing teams' BIP are included.
Spanning from the 2020 season to the current 2024 season, Cleveland has had two seasons in which the home run rate at Progressive Field was above the league average. In 2021, the home run rate at Progressive Field was nearly 0.5% higher than the league average. After 2021, the rate dropped significantly below the league average until the current 2024 season. Now, Progressive Field is again seeing home run rates soar above the league average, but at an even larger margin. This season, the home run rate at Progressive Field is nearly 1% higher than the league average—double the margin from 2021. These large, linear changes in home run rates at Progressive Field once again raise the question as to whether this is performance related or there may be an outside factor causing higher carry on each batted baseball.
Predicting Home Run Rates
The Cleveland Guardians have seen 182 home runs at Progressive Field both on offense and defense combined through the first 81 games. This translates to a home run rate of just over 5% on balls in play, significantly higher than the rest of the league with an average of 3.7% (excluding Cleveland). This unusually high home run rate is notable, especially since Cleveland was below the league average in the previous two seasons.
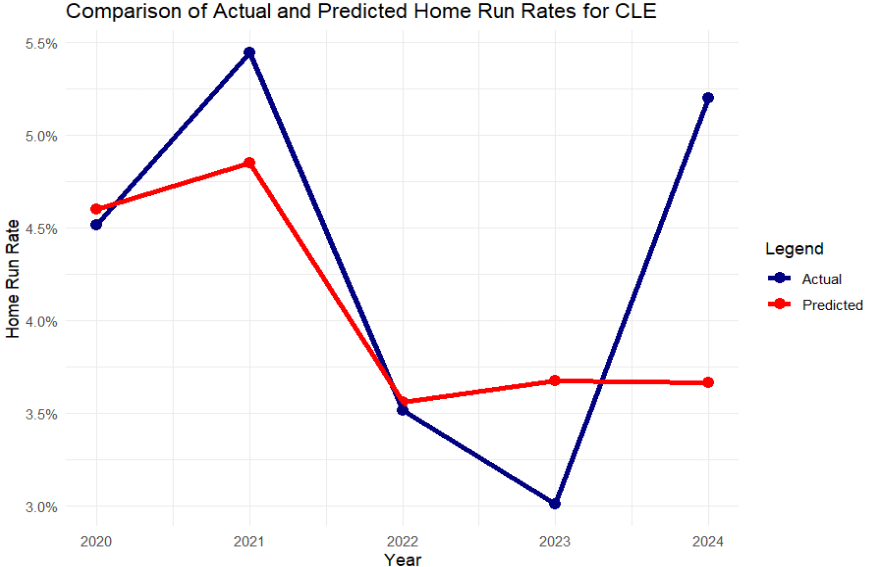
The line chart displays the predicted home run rate compared to the actual home run rate at Progressive Field during each year from 2020 to 2024.
The GLM proves to be accurate, with most years closely matching the actual home run rates. However, a major outlier lies in the actual home run rate at Progressive Field during the 2024 season. The predicted home run rate is more than 1.5% lower than the actual rate, indicating something unusual is happening in Cleveland. Although this is somewhat similar to 2021 when the rates were also above the predicted level, a jump of 1.5% is too large to be attributed solely to randomness over the entire first half of a season. Could the outlier be related to a ‘wind tunnel’? To investigate further, we can compare the actual and predicted distances of every baseball hit at Progressive Field during the 2024 season.
Comparing Actual Hit Distance to Predicted Hit Distance
Play-by-play data from the 2024 season was scraped from Fangraphs using the baseballr package in R Studio. We filtered the data to include only fly balls hit to the right side of the field that traveled more than 150 feet, ensuring each ball would have enough height to be affected by any wind gusts. This approach allowed us to accurately assess the effects of the right field ‘wind-tunnel’ at Progressive Field and other ballparks.
A Generalized Additive Predictive Model (GAM) was trained using the filtered data from all 29 other ballparks in MLB, excluding Progressive Field. The model’s independent variables were Launch Angle and Launch Speed, commonly used in similar studies. The goal was to predict hit distances at Progressive Field for fly balls to right field based on the model’s findings. Predicted distances were then compared to actual results. Hypothetically, Progressive Field should exhibit higher actual distances on fly balls to right field compared to predicted distances due to the ‘wind-tunnel’ effect.
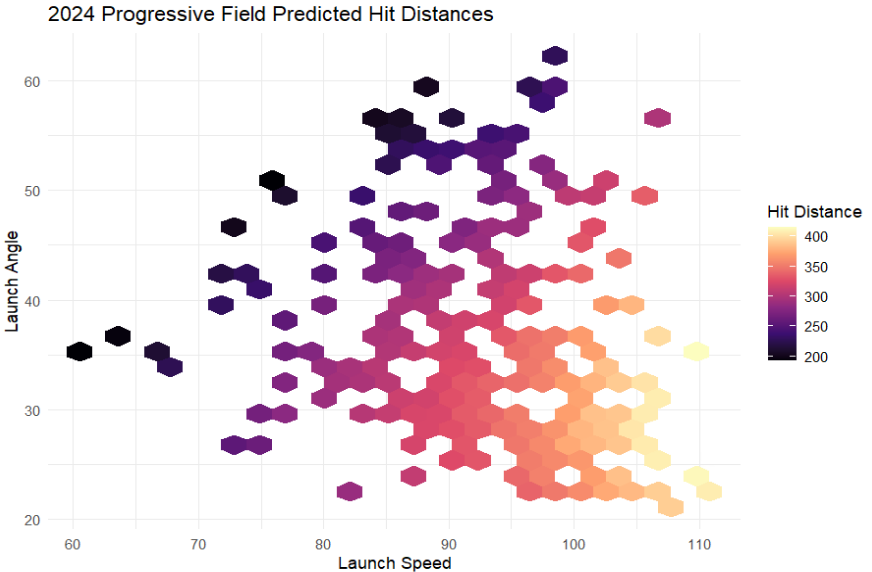
The chart displays a heatmap for projected hit distances at Progressive Field during the 2024 season according to the GAM.
The Predicted Hit Distance chart illustrates how an increase in Launch Speed correlates with increased hit distance. Additionally, it shows that a Launch Angle between approximately 20 and 35 degrees is optimal for maximizing hit distance. Based on other MLB stadiums, the model predicts that hit distance increases when Launch Angle and Launch Speed increase at highly collinear rates. How does this prediction compare to the actual distances of batted balls across different Launch Speed and Launch Angle intersections?
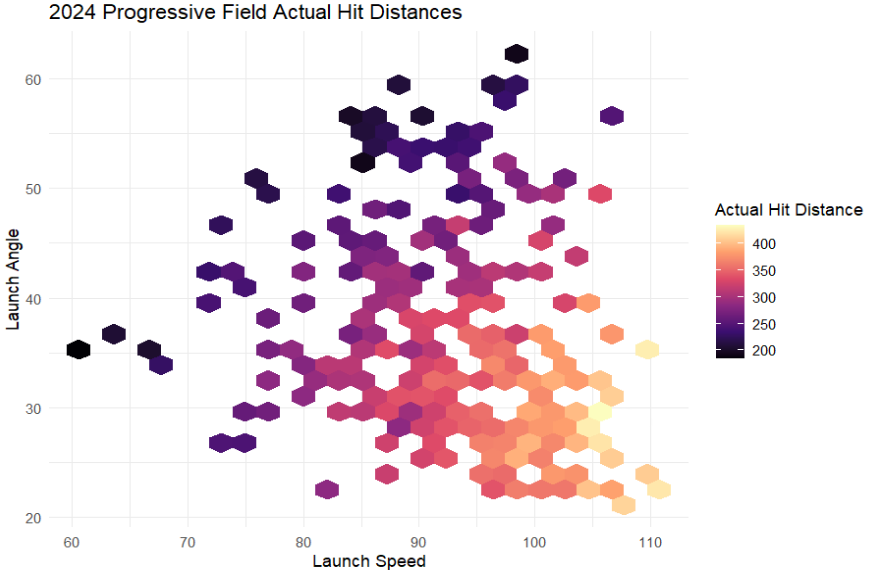
The chart displays a heatmap for actual hit distances at Progressive Field during the 2024 season.
There are only minor discrepancies between this chart and the predicted hit distance chart. However, each differing point on the heatmap is crucial for determining any outside factors that could be affecting the carry of a baseball. This chart displays some of the larger hit distances skewed slightly to the left or with smaller Launch Speeds. This suggests that there may be another factor, outside of Launch Speed and Launch Angle, influencing hit distance within Progressive Field.
Evaluating the Carry of the Fly Ball in 2024
Continuing with the GAM predictions, the model indicated that actual hit distances were higher than predicted distances at a rate of 58% while lower at a rate of 42%. This means that 8% of the time, baseballs are traveling further than expected to right field. For a left-handed batter with more pull-side power to right field, this creates a favorable condition, increasing their opportunity for home runs.
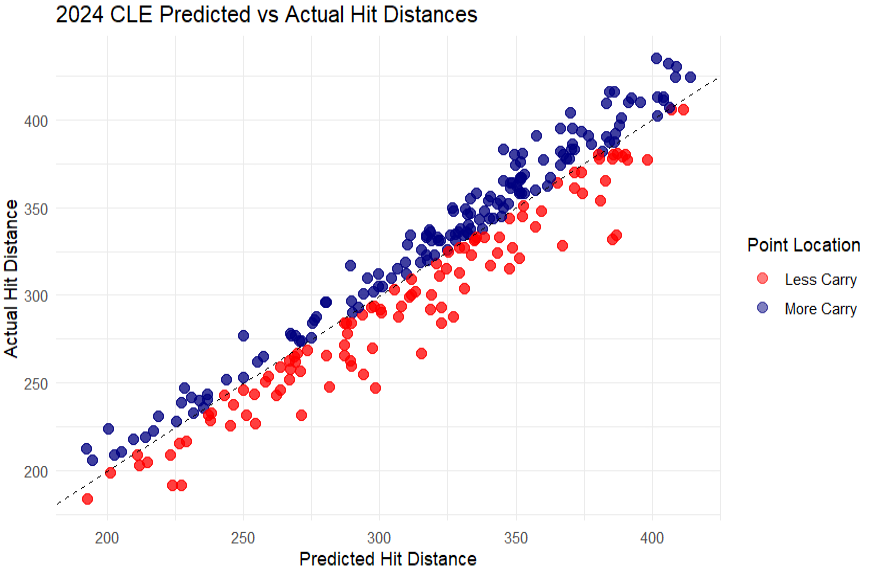
The chart displays a scatterplot comparing the actual hit distance and predicted hit distance of each fly ball meeting the filtered crtieria within the model.
During the 2023 season at Progressive Field, out of every fly ball in play, 10% resulted in home runs. During the 2024 season, Progressive Field has seen a 7% increase in home runs on every fly ball in play. With more suggested carry to right field from the alleged ‘wind-tunnel’, Progressive Field should be showing higher home run percentages on fly balls to right field as a result. Let’s take a look at how the carry of the ball on fly balls to right field has changed over the past 5 seasons.
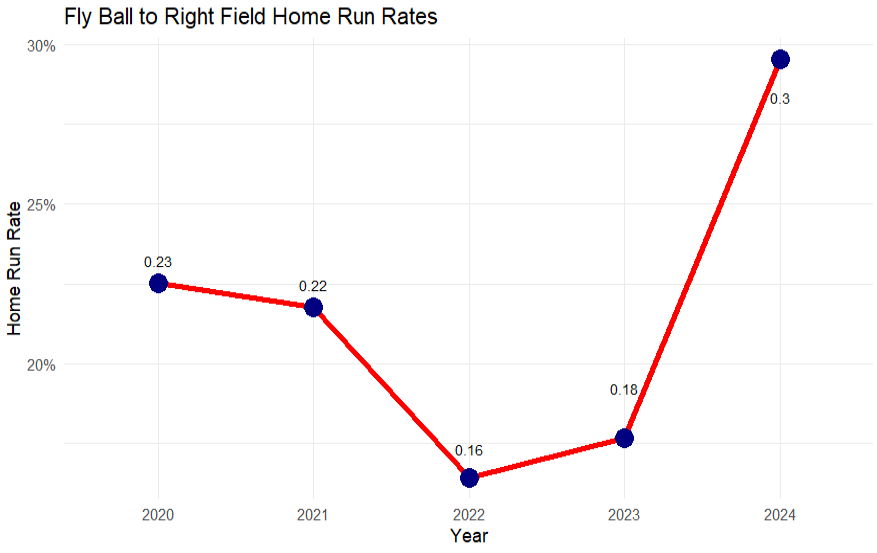
The chart displays a scatterplot comparing the carry of a fly ball to the right side of the field with a distance of at least 150 feet. This means that the ball would likely interact with the 'wind-tunnel'.
Over the past five years, fly balls to right field in Cleveland have resulted in home run rates between 16% and 23%. However, during the 2024 season, this rate has surged to 30%. With data from 81 games, it is evident that balls are carrying further in this part of the ballpark, turning hits near the outfield wall into home runs. This phenomenon has provided Cleveland with more home run opportunities due to an unnatural factor. Additionally, the team’s improved power in their offensive lineup, has contributed to the increased home run rate.
Conclusion
Overall, an external factor appears to be causing balls to carry much further in Cleveland, primarily right field, compared to previous years. Our GAM analysis indicates this, but we cannot attribute it definitively to a ‘wind-tunnel’. There is a possibility of unusual spin rates at Progressive Field this year contributing to increased carry. This variability could also be related to changes in the baseball, such as the ‘deadened ball year’ in 2021 or the ‘juiced baseballs year’ in 2019. Additionally, wind patterns may be accelerating and carrying the ball further to right field due to the open space beyond the wall. Until we have more concrete and publicly data, all possibilities remain on the table, and this trend continues to warrant further investigation.
Sources
Albert, J., & Nathan, A. M. (2024, June 21). Balls are traveling farther in 2024 in Progressive Field. Baseball Prospectus. https://www.baseballprospectus.com/news/article/91708/balls-are-traveling-farther-in-2024-in-progressive-field/#comment-234269
Grove, C. (2022, January 3). Predicting hit distances & investigating changes to the ball in 2021. Predicting Hit Distances & Investigating Changes to the Ball in 2021. https://baseballaheadinthecount.blogspot.com/2022/01/predicting-hit-distances-investigating.html
Progressive Field Renovations. Progressive Field reimagined. (n.d.). https://guardians.fanportal-mlb.com/renovations/pennant-district-groups-space