SMT 2024 Data Challenge
Published:
Uncovering Pre-Pitch Movements by Shortstops Revealing Pitch Tendencies
Abstract
In baseball, pre-pitch movements by fielders, particularly shortstops, play a crucial role in optimizing positioning and readiness. These movements may also reveal clues about upcoming pitch attributes, potentially providing hitters with a predictive advantage. With little to no previous research published on this topic, there is ground to be gained for MLB teams in conducting research on whether pre-pitch movements do tip pitch attribute tendencies. This study addresses the research gap by analyzing pre-pitch movements by shortstops to determine if they offer insights into the predictability of pitch attributes such as pitch location, pitch type, and vertical break.
The data provided by the SMT 2024 Data Challenge included ball and player tracking across nearly a season and a half for multiple levels of baseball within a single anonymous organization. To manage complexity, the analysis focused on one level of baseball and focused solely on the shortstop position. Pre-pitch movements were assessed for their predictive power regarding pitch attributes.
The assessment was done using Generalized Linear Models, with separate analysis done for right-handed and left-handed batters. Results indicated that pre-pitch movements do indeed offer modest predictive value for pitch location and pitch type in particular, with models for right-handed hitters performing better than left-handed. The study found that, although better than randomly guessing at an upcoming pitch, the predictions are not highly reliable. Overall, though, the movements by shortstops can offer hitters a slight potential area in predicting a pitches attribute.
The findings highlight the need for further research with the proper data into how different fielders’ pre-pitch movements might signal either pitch attributes or pitch types, emphasizing the importance of analyzing detailed fielding routines and coaching practices.
1. Introduction
In baseball, a pre-pitch movement allows fielders to optimize positioning and readiness, significantly impacting their ability to make plays effectively. According to Diamond Dreams Baseball Academy, players develop a strategy for reacting if the ball is put into play. Infielders, especially shortstops, use foot movement and stances to adjust their readiness based on pitch signals.
Figure1.1

Dustin Pedroia with his pre-pitch hop into position. If this tennis-hop were to occur by gravitating in a certain direction depending on the pitch, he would be slightly tipping pitches.
However, there is limited research on whether these pre-pitch movements tip pitch tendencies to the batter. This leads us to the question, do pre-pitch movement tendencies by shortstops provide clues about the attributes of an upcoming pitch? Through a detailed analysis of pre pitch movements and pitch type outcomes, this research demonstrates that specific movement patterns can be associated with pitch types and locations, thus offering a predictive advantage for hitters.
2. Data
For this study, data was obtained from the SMT 2024 Data Challenge, encompassing approximately one and a half seasons of gameplay. The dataset was anonymized to obscure overall demographic details, ensuring that the identities of teams and players remained confidential. The dataset comprises several critical components:
- General Game Information: Provides details about each game, including unique identifiers for teams and players.
- Ball Position Tracking: Precise tracking of the ball’s position was recorded every 50 milliseconds. It features x, y, and z (height) coordinates, with x and y coordinates relative to the back point of home plate.
- Player Position Tracking: Player positions are recorded every 50 milliseconds. This includes x and y coordinates, allowing for detailed analysis of player movements.
- Game Play Events: This records key events like pitch throws and ball catches, organized chronologically. It excludes minor events such as hits or outs.
2.1 Data Processing & Analysis
This study focused on the 4A level to manage the large volume of player positioning data within R Studio’s limits, excluding data from other levels for efficient processing. Additional events were added to the play-by-play data to capture pre-pitch movements, including codes for the ball in the air during the pitch and the phase between plays.
Figure 2.1
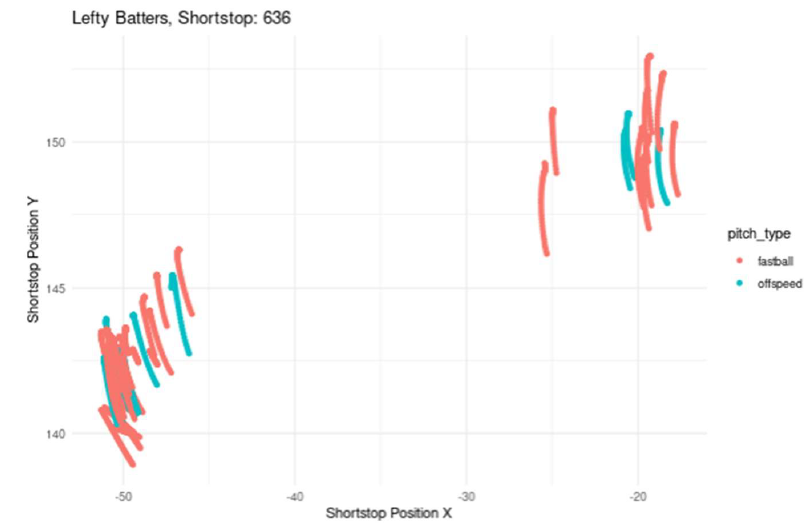
This figure displays pre-pitch movement player tracking data for shortstop 636 for a single game when there were only lefty batters at the plate. The colors represent the pitch type thrown after each pre-pitch movement.
Figure 2.2
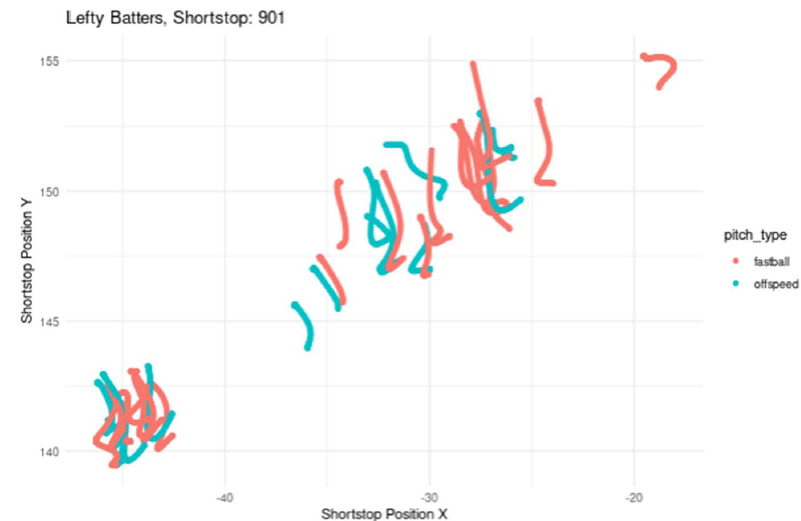
This figure displays pre-pitch movement player tracking data for shortstop 901 for a single game when there were only lefty batters at the plate. The colors represent the pitch type thrown after each pre-pitch movement.
Each shortstop exhibits unique pre-pitch movements: for example, Shortstop 636 moves straight towards home plate with minimal variation, while Shortstop 901 moves back towards the middle of the field. The study analyzes how these movements might predict pitch attributes.
To manage the data, only timestamps related to shortstops were retained. Missing values in IDs and player position tracking data were addressed to ensure the dataset’s integrity. The cleaned dataset included 764,760 observations over 10,504 pitches at the 4A level.
3. Methodology
This study uses a quantitative research design to analyze the correlation between pre-pitch player position tracking and upcoming pitch attributes. First, a new variable identified whether each pitch was thrown on the left or right side of the strike zone, measuring the horizontal ball position (x) at the closest point to the plate (y=0). Due to data being recorded every fifty milliseconds, some data points were missing, including instances where the ball crossed the plate. To combat this, the x location was determined at the closest point to the plate in which the ball was recorded. This was the first major attribute towards predicting a pitch.
A new variable was created to calculate pitch speed. Using J.J. Cooper’s method from Baseball America, velocity was measured at 50 feet from the plate, as traditionally done in MLB until recently. Due to missing data when the ball is exactly 50 feet from the plate, speed was instead measured at data points between 55 and 45 feet, covering 99% of the pitches. Speed was calculated using the formula Distance/Time in feet per second and then converted to miles per hour (MPH) by multiplying by approximately 0.68.
Based on the speed of each pitch thrown, a binary variable was calculated to classify each pitch as either an off-speed pitch or a fastball variant. A pitch was classified as a fastball if it fell within the top 7% of each pitcher’s velocity range, ensuring that all fastball pitches had a mean speed of 91.6 mph. This is just below the MLB average of around 92 mph, providing a solid benchmark. This binary classification of pitch type is a key attribute in the analysis.
Vertical break for each pitch was calculated by determining when the pitch was in the air and gathering the ball_position_z measurements to measure the change in height. The change in heights was identified as the vertical break. Once this was calculated, the 50th percentile of the vertical break was determined. A new variable was created using percentile-based binarization to classify pitches as having a high vertical break versus a low vertical break at the 50th percentile, which is another key attribute in the analysis.
A new variable was created to label the location where each ball was hit, categorizing it as either the left side, up the middle, or the right side. Based on hit charts from FanGraphs, 15- degree angles were used to split the zones between left center field and right center field, effectively representing the three batting zones. The data was then filtered based on x and y coordinates to determine the zone for each hit.
A K-Means Clustering approach was used to predict batter handedness, categorizing batters as right-handed or left-handed while excluding switch hitters. The model used pitch location, pitch speed, and ball acquisition coordinates to predict handedness, hypothesizing that pitch location influences whether a batter hits to the left or right field.
Generalized Linear Models (GLMs) were then developed to predict pitch attributes based on pre-pitch movements. The data was analyzed separately for right-handed and left-handed hitters, as each group was expected to yield different results. The models predicted pitch location, pitch type (fastball or off-speed), and vertical break (high or low) using pre-pitch movements. Performance was evaluated using Accuracy, Recall, Precision, and F1 Score to assess how well pre-pitch movements can predict pitch attributes and the effectiveness of each model.
4. Results
Each model was analyzed using 4 metrics: Accuracy, Recall, Precision and F1 Score. The combination of each metric determines whether the model was successful in predicting the outcome of pitch attributes. Recall measures the proportion of actual positive cases that are identified correctly. Precision measures the proportion of predicted positive cases that are correct. Finally, F1 Score measures the balance of precision and recall.
4.1 Model Performance: Left-Handed Hitters
4.1.1 Pitch Location
The model predicts whether a pitch will be on the left or right side of the plate based on prepitch movements from the shortstop with a lefty batter accumulating a 55.9% success rate.
Figure 4.1
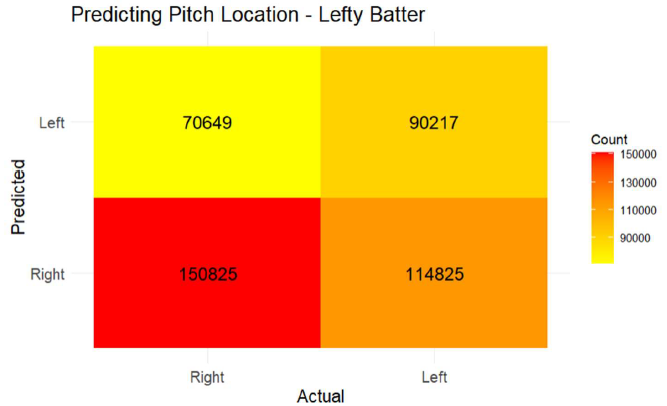
Higher values in the bottom right indicate a weaker model. The model struggles to predict any True Positives in the top right quadrant.
However, the model has an F1 score of 41%, reflecting a low Recall score. This indicates that while the model is quite precise when it predicts a fastball, it is conservative and only classifies a pitch as a fastball when it is very confident. As a result, the model misses many fastballs, suggesting that although there is a detectable trend, the pre-pitch movements do not consistently predict fastballs with high reliability.
4.1.2 Pitch Type
The objective of this model is to predict pitch types—either fastball or off-speed—based on pre-pitch movements recorded from the shortstop’s position when the batter is left-handed. The model achieves a prediction accuracy of 57.7%, which indicates a slight edge over random guessing and offers the hitter a competitive advantage indicating slight pitch tipping.
Figure 4.2
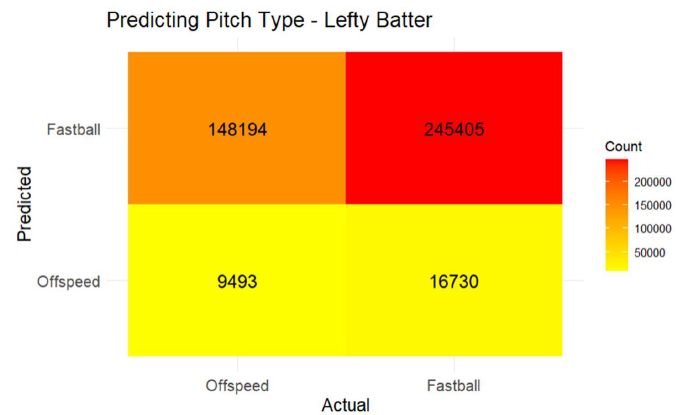
Higher values in the top right indicate a stronger model. The model has lots of success predicting fastballs as a result there are many True Positives in the top right quadrant.
With an F1 score of 71%, the model demonstrates a strong balance between the ability to correctly identify pitches which is due to a high recall score with a small number of false positives. The model provides valuable predictions about upcoming pitch attributes based on shortstop movements, making it a useful tool for anticipating pitch types.
4.1.3 Vertical Pitch Break
The goal of this model is to predict whether a pitch will exhibit a high vertical break based on pre-pitch movements from the shortstop’s position when there is a lefty batter. The model achieves an accuracy of 51.2%, indicating a model similar to randomly guessing.
Figure 4.3
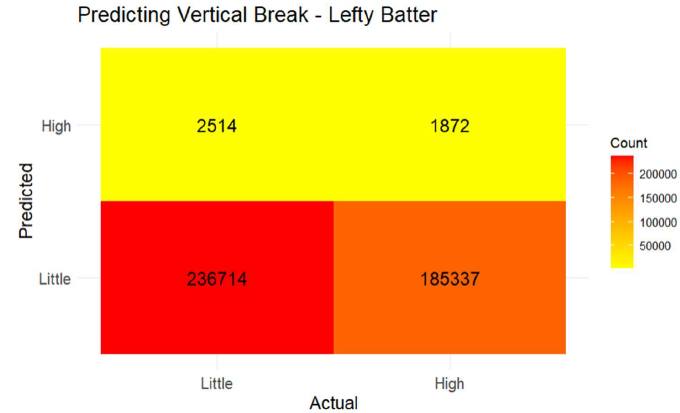
Higher values in the bottom right indicate a weaker model. The model struggles to predict a High Vertical Break. The smallest quadrant is the True Positives in the top right.
With an F1 score of 41.6%, the model shows it can predict a high vertical break with a recall of 64.8%. However, the model struggles in detecting when it should predict them due to precision. The overall lower performance of the model shows that it is difficult to predict the vertical break of an upcoming pitch based solely upon the shortstop’s pre-pitch movement.
4.2 Model Performance: Right-Handed Hitters
4.2.1 Pitch Location
The goal of this model is to predict whether an upcoming pitch will be on the left or right side of home plate based on the shortstop’s pre-pitch movement when the batter is a right-handed hitter. With an accuracy of 55.9%, the model suggests that shortstops offer some level of hinting towards pitch location and an advantage to the hitter.
Figure 4.4
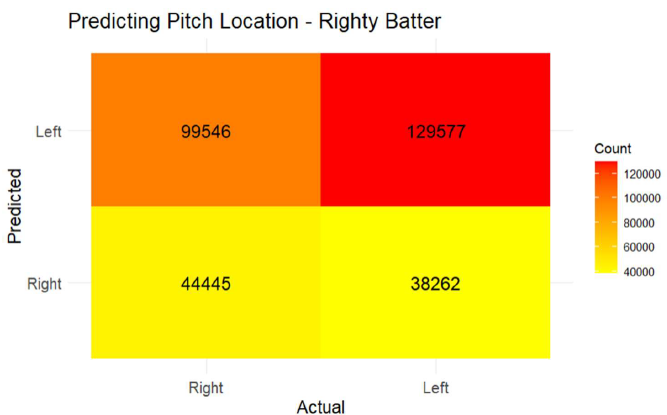
Higher values in the top right indicate a stronger model. The model has lots of success predicting fastballs and many True Positives in the top right as a result.
When the model predicts a pitch location it will be accurate 56.2% of the time according to the precision. With a recall score of 69.4% the model indicates success in identifying pitches that fall into the predicted location. The results imply that while the model may not be perfect, it provides a solid foundation for predicting pitch location.
4.2.2 Pitch Type
The objective of this model was to predict pitch types—either fastball or off-speed—based on pre-pitch movements recorded from the shortstop’s position when the batter is right-handed. The model achieves an accuracy of 61%, indicating pre-pitch movements from the shortstop offer meaningful insights into the pitch type.
Figure 4.5
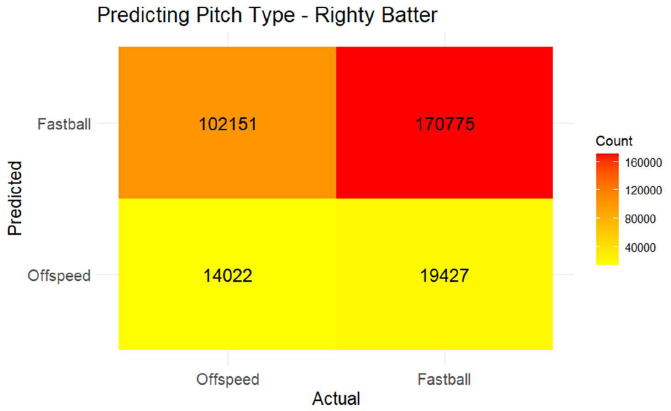
Higher values in the top right indicate a much stronger model. The model has lots of success predicting fastballs with many True Positives in the top right quadrant.
A high recall of 92% indicates that the model is very effective correctly identifying the pitch type when it is called upon by the precision to make a prediction. The model demonstrates a strong performance identifying the pitch type to be a fastball.
4.2.3 Vertical Pitch Break
The goal of this model is to predict whether the vertical break on an upcoming pitch will be high or low based upon the pre-pitch movement of the shortstop. The model demonstrates an accuracy of 52.2%, offering insight into what type of vertical break is expected based on the shortstop movement.
Figure 4.6
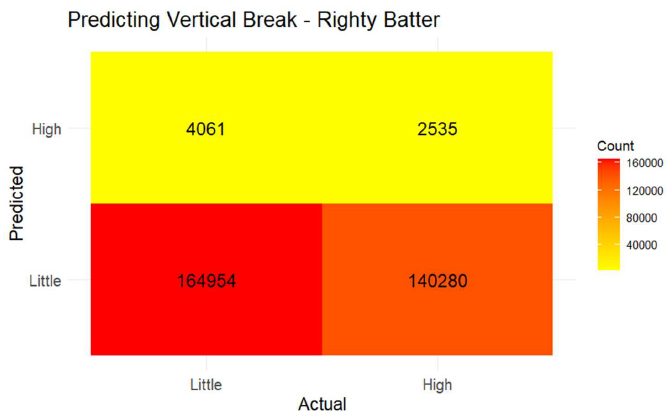
This heatmap demonstrates a large number of true positives in the top right quadrant. This means the model has success predicting a Hight Vertical Break.
The F1 score of 58.5% reflects a mild balance between precision and recall. Meaning when the model predicts a high vertical break, it is correct only 52.3% of the time due to precision. The high recall compared to precision indicates a large number of false positives within the predictions. In summary, the model provides a moderate prediction of vertical pitch break based on pre-pitch movements.
Interestingly, the models generally performed better for predicting pitch attributes when the hitter is right-handed. This could be because the shortstop aligns on the same side of the field as the batter in this instance, providing a more straightforward angle for detecting and interpreting the shortstop’s pre-pitch movements. This alignment likely facilitates better visibility and a more direct correlation between the shortstop’s movements and the pitch attributes, enhancing the model’s predictive power.
5. Shiny App
The Shiny App’s user interface allows interaction with player tracking data, as shown in Figures 2.2 and 2.3. Users can explore pre-pitch movements for each shortstop at the 4A level, filtered by game, play, and pitch attribute. A second tab provides heatmaps for analyzing player positioning during pre-pitch movements. The figures highlight individual player movement patterns and trends associated with each pitch attribute. Vertical Break was excluded due to poor model performance in identifying trends related to pre-pitch movements.
6. Conclusion
Currently, there is a lack of research focused on how fielder pre-pitch movements might signal pitch types to batters. This gap presents a significant opportunity for MLB teams to conduct more in-depth studies with proper data including batter handedness. By analyzing specific pitchers and their pitch repertoires, teams could uncover valuable insights into how these pre-pitch cues might be used to predict pitch types and gain a competitive edge.
The models show that pre-pitch movements of the shortstop position offer subtle yet significant cues about upcoming pitch attributes. While the correlations may be small, they are enough to provide hitters with a potential advantage in anticipating pitch types and locations. These insights highlight the importance of even the most nuanced aspects of fielding positions and their impact on the game.
Shiny Application
https://jjbalek.shinyapps.io/Final_SMT_app/
Acknowledgements
I would especially like to thank Dr. Meredith Wills for the outstanding support and critique throughout the entire length of this project.
References
API, S. (2022, July 4). Understanding rapsodo pitching data: Break profile (fastball). Rapsodo. https://rapsodo.com/blogs/baseball/understanding-rapsodo-pitching-data-break-profilefastball
Cooper, J. J. (2023, November 8). The measure of a fastball has changed over the years. College Baseball, MLB Draft, Prospects - Baseball America. https://www.baseballamerica.com/stories/the-measure-of-a-fastball-has-changed-overthe- years/
The importance of Pre-Pitch Movement. GRB Academy. (2020, January 29). https://grbacademy.com/2020/01/29/the-importance-of-pre-pitchmovement/#:~: text=It%20allows%20players%20to%20be,but%20an%20important%20o ne%20nonetheless.
K, C. (n.d.). Dustin Pedroia Ready Position. Colonial Baseball Instruction. Retrieved August 10, 2024, from https://colonialbaseballinstruction.com/3121/coaching-baseball-pre-pitchroutine-defense.
