
Has Cleveland Created A ‘Wind-Powered’ Long Ball Haven With Their Recent Stadium Renovations?
Published:
During the offseason preceding the 2024 season, the Cleveland Guardians decided to undertake a series of renovations across the stadium. One major change involved the upper deck of seats in right field, which was revamped to create a new group outing space. This renovation involved removing old walls and seats, transitioning to a more open and social layout with increased access to concession stands
Old
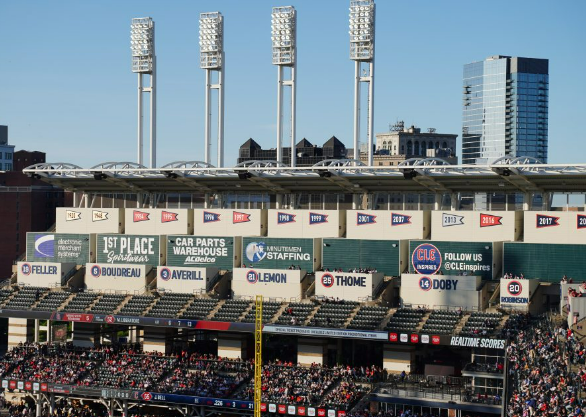
Illustration courtesy of Cleveland Guardians.
New
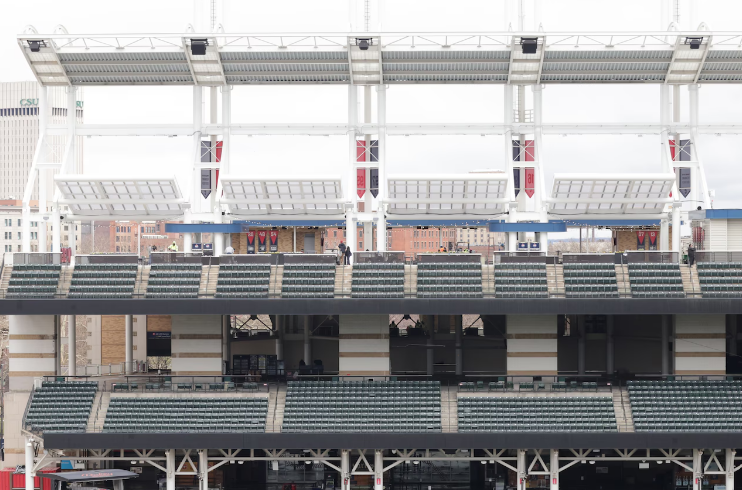
Illustration courtesy of David Petkiewicz, cleveland.com.
The Cleveland offense has shown a surge in power numbers across the board, prompting speculation about whether this can be attributed to a potential wind tunnel created by renovations in right field. Others speculate that the team’s success simply reflects improvements in their offseason work ethic and overall offensive capabilities.
Offensive Numbers
This year, Cleveland has noticeably improved their power hitting compared to last season, leading them to hold a top 3 record across the league after their first 75 games. At home, Cleveland is averaging 5.17 runs per game in the 2024 season, an increase of 1.38 runs compared to 2023. On the road, they are scoring 4.95 runs per game in 2024, up by 0.57 runs from last year. The larger increase in runs per game at home raises the question: what is contributing to this difference?
At home this year, Cleveland is hitting an average of 1.4 home runs per game, compared to 0.67 home runs in 2023. On the road, they are hitting 0.975 home runs per game in 2024, slightly up from 0.86 in 2023. However, the increase in home runs per game at home is significantly more pronounced than on the road.

Illustration courtesy of Stephanie Scarbrough from the Herald-Star.
Cleveland’s most impressive statistic in the 2024 season is their slugging percentage (SLG) at home, where they rank 9th best in MLB with a .422 SLG. This marks a significant increase of .045 from 2023. The Guardians achieve this high SLG primarily through home runs, as they rank last in MLB in both triples (3B) and singles (1B). According to Statcast, the Guardians also rank in the bottom two for barrel percentage and hard-hit percentage across the league.
To further analyze this, let’s compare all balls hit at Progressive Field between the 2023 and 2024 seasons for both the Guardians and visiting teams. This comparison will help us identify any physical differences in batted ball distribution before and after the renovations.
Expectd Distance vs. Actual Distance
Recently, I reviewed an article by Jim Albert and Alan Nathan exploring whether a wind tunnel effect could be contributing to an offensive surge in Cleveland. They constructed a model to assess the probability of a home run for each batted ball and compared this year’s data with previous seasons. As I develop my own model and interactive chart, I found some of their results particularly intriguing.
One notable finding is depicted in a basic scatter plot illustrating home runs per balls-in-play for Cleveland compared to all MLB parks, based on data up to June 15 of the 2024 season. Cleveland has markedly risen from being below league average to above average this year. This trend suggests a notable increase in home runs, not just attributable to Cleveland’s offense but possibly indicating a higher rate of balls leaving the park. However, it’s important to note that this conclusion is drawn from a relatively small sample size, which limits its decisiveness.
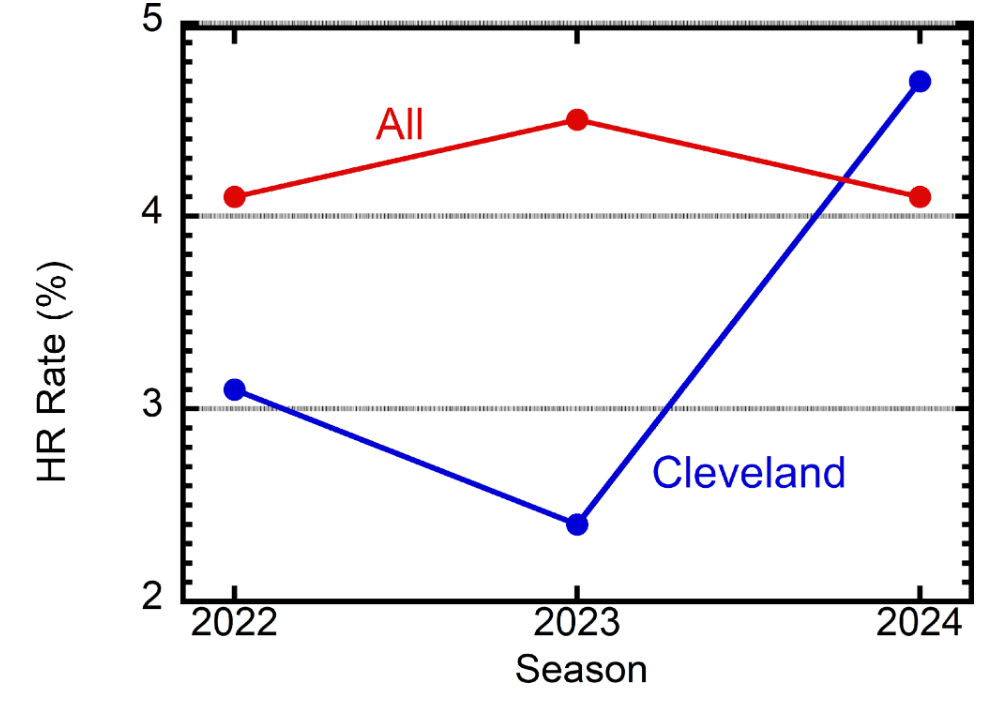
Illustration courtesy of Jim Albert and Alan Nathan.
Next, I examined the predicted and actual home run rates specifically for Progressive Field, using a generalized additive model developed by Albert and Nathan with data from other MLB parks. I aim to replicate a similar analysis on a broader scale.
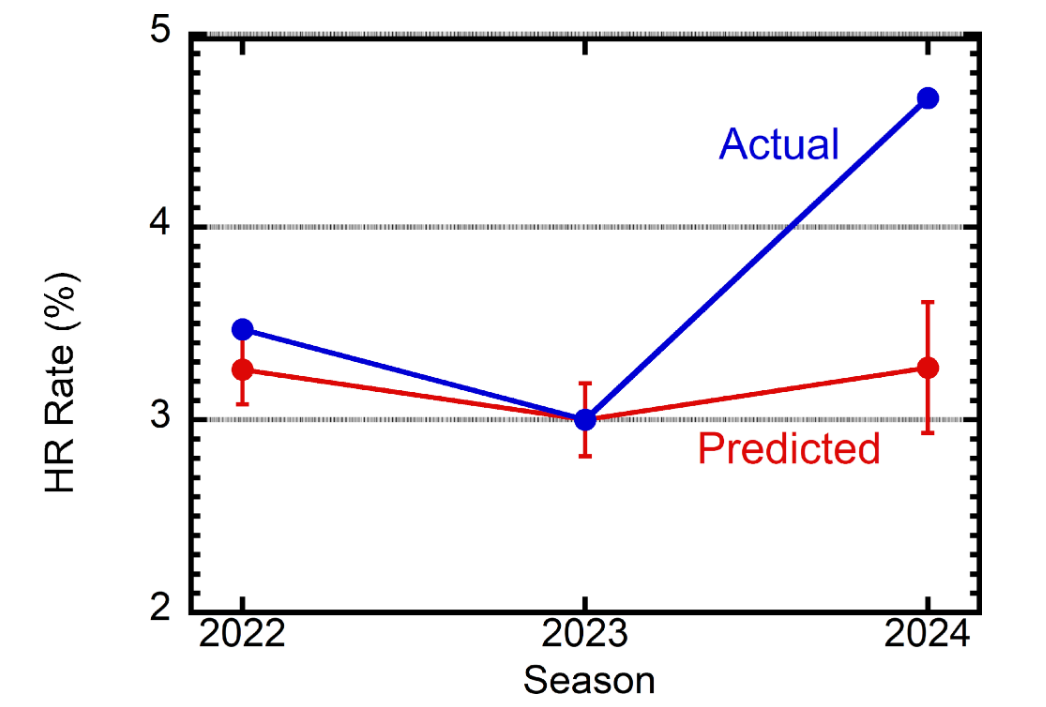
Illustration courtesy of Jim Albert and Alan Nathan.
It’s evident that fly balls are traveling farther than anticipated, resulting in more home runs than predicted. However, drawing conclusions about the presence of wind tunnels at this stage is not plausible due to the limited sample size. Factors such as randomness in ballpark conditions and varying spin rates across the league, which may not have been fully accounted for in the modeling, could also contribute to these observations. Without exact spin rates and more data, it cannot be concluded as to whether or not there is a true wind-tunnel occuring to right field in Cleveland this year.
Personal Approach and Modeling
Read a more personalized report within my portfolio folder. This can be found at Progressive Field ‘Wind-Tunnel’.
Sources
The Herald Star. (2024, June 25). Ramírez’s tiebreaking homer lifts guardians. heraldstaronline.com. https://www.heraldstaronline.com/sports/local- sports/2024/06/ramirezs-tiebreaking-homer-lifts-guardians/
Perdue, S. (2023, June 18). Ballpark Review: Progressive field (cleveland guardians). Perfuzion. https://www.perfuzion.com/ballpark-review-progressive-field- cleveland-guardians/
Pluto, T. (2024, June 15). I’m at war with the Progressive Field “wind tunnel” theory. the Guardians are good, period! – Terry Pluto. cleveland.com. https://www.cleveland.com/guardians/2024/06/im-at-war-with-progressive-field-wind-tunnel-theory-guards-are-good-period-terry-pluto.html
Albert & Nathan article
Searle, G. (2024, June 25). Balls are traveling farther in 2024 in Progressive Field. Baseball Prospectus. https://www.baseballprospectus.com/news/article/91708/balls-are-traveling-farther-in-2024-in-progressive-field/